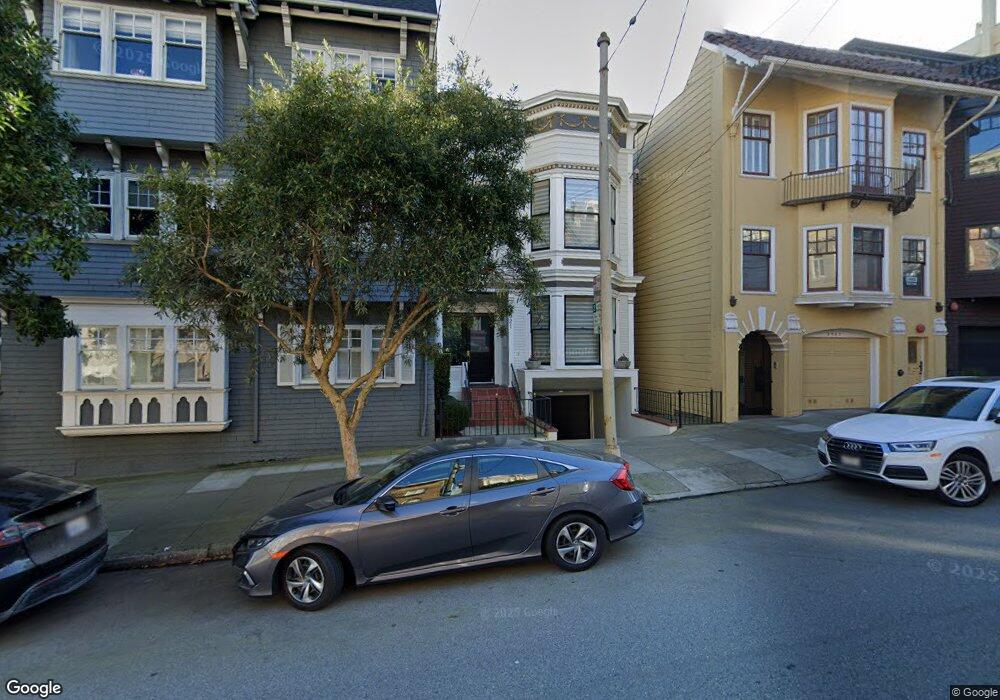
2921 Jackson St San Francisco, CA 94115
Pacific Heights NeighborhoodEstimated Value: $2,912,000 - $5,393,000
5
Beds
4
Baths
2,940
Sq Ft
$1,599/Sq Ft
Est. Value
About This Home
This home is located at 2921 Jackson St, San Francisco, CA 94115 and is currently estimated at $4,699,709, approximately $1,598 per square foot. 2921 Jackson St is a home located in San Francisco County with nearby schools including Cobb (William L.) Elementary School, Roosevelt Middle School, and San Francisco Waldorf School.
Ownership History
Date
Name
Owned For
Owner Type
Purchase Details
Closed on
Nov 17, 2015
Sold by
Beam Lezlie J
Bought by
Beam Lezlie J
Current Estimated Value
Purchase Details
Closed on
Nov 8, 2013
Sold by
Korenberg Matthew E and Korenberg Cindy R
Bought by
Beam Lezile J
Home Financials for this Owner
Home Financials are based on the most recent Mortgage that was taken out on this home.
Original Mortgage
$2,000,000
Outstanding Balance
$1,487,942
Interest Rate
4.17%
Mortgage Type
Commercial
Estimated Equity
$3,211,767
Purchase Details
Closed on
Mar 15, 2010
Sold by
Pepper Sanford R and Fulford Janis A
Bought by
Korenberg Matthew E and Korenberg Cindy R
Home Financials for this Owner
Home Financials are based on the most recent Mortgage that was taken out on this home.
Original Mortgage
$1,950,000
Interest Rate
2.55%
Mortgage Type
Commercial
Purchase Details
Closed on
Apr 4, 1997
Sold by
Pepper Virginia
Bought by
Pepper Md Sanford R and Fulford Janis A
Home Financials for this Owner
Home Financials are based on the most recent Mortgage that was taken out on this home.
Original Mortgage
$495,000
Interest Rate
8.25%
Mortgage Type
Commercial
Create a Home Valuation Report for This Property
The Home Valuation Report is an in-depth analysis detailing your home's value as well as a comparison with similar homes in the area
Home Values in the Area
Average Home Value in this Area
Purchase History
| Date | Buyer | Sale Price | Title Company |
|---|---|---|---|
| Beam Lezlie J | -- | None Available | |
| Beam Lezile J | $3,850,000 | First American Title Company | |
| Korenberg Matthew E | $2,600,000 | First American Title Company | |
| Pepper Md Sanford R | -- | Fidelity National Title Co |
Source: Public Records
Mortgage History
| Date | Status | Borrower | Loan Amount |
|---|---|---|---|
| Open | Beam Lezile J | $2,000,000 | |
| Previous Owner | Korenberg Matthew E | $1,950,000 | |
| Previous Owner | Pepper Md Sanford R | $495,000 |
Source: Public Records
Tax History Compared to Growth
Tax History
| Year | Tax Paid | Tax Assessment Tax Assessment Total Assessment is a certain percentage of the fair market value that is determined by local assessors to be the total taxable value of land and additions on the property. | Land | Improvement |
|---|---|---|---|---|
| 2025 | $56,725 | $4,877,645 | $3,303,697 | $1,573,948 |
| 2024 | $56,725 | $4,782,006 | $3,238,919 | $1,543,087 |
| 2023 | $55,897 | $4,688,243 | $3,175,411 | $1,512,832 |
| 2022 | $54,875 | $4,596,318 | $3,113,149 | $1,483,169 |
| 2021 | $53,916 | $4,506,196 | $3,052,107 | $1,454,089 |
| 2020 | $54,158 | $4,459,992 | $3,020,812 | $1,439,180 |
| 2019 | $52,288 | $4,372,543 | $2,961,581 | $1,410,962 |
| 2018 | $50,518 | $4,286,808 | $2,903,511 | $1,383,297 |
| 2017 | $49,624 | $4,202,754 | $2,846,580 | $1,356,174 |
| 2016 | $47,444 | $3,986,806 | $2,790,765 | $1,196,041 |
| 2015 | $46,859 | $3,926,922 | $2,748,846 | $1,178,076 |
| 2014 | $45,621 | $3,850,000 | $2,695,000 | $1,155,000 |
Source: Public Records
Map
Nearby Homes
- 2990 Jackson St Unit 4
- 2850 Jackson St
- 3124 Washington St
- 2830 Pacific Ave
- 2800 Pacific Ave
- 2033 Broderick St
- 2725 Broadway St
- 2121 Divisadero St
- 2898 Broadway St
- 2833 Vallejo St
- 2221 Scott St
- 2881 Vallejo St
- 2046 Divisadero St
- 1819 Lyon St Unit 3
- 1819 Lyon St Unit 1
- 2051 Scott St Unit 101
- 2829 California St Unit 2
- 3100 California St
- 3332 Washington St
- 2735 Clay St Unit 1
- 2919 Jackson St Unit 2919
- 2917 Jackson St
- 2915 Jackson St
- 2923 Jackson St Unit 2
- 2923 Jackson St Unit 1
- 2929 Jackson St Unit 2929
- 2927 Jackson St
- 2925 Jackson St
- 2911 Jackson St
- 2907 Jackson St
- 2909 Jackson St
- 2947A Jackson St
- 2949 Jackson St Unit A
- 2949 Jackson St
- 2947 Jackson St Unit A
- 2947 Jackson St
- 2213 Broderick St
- 2957 Jackson St
- 2249 Broderick St Unit 2249
- 2251 Broderick St