Estimated Value: $207,097 - $235,000
--
Bed
2
Baths
1,824
Sq Ft
$122/Sq Ft
Est. Value
About This Home
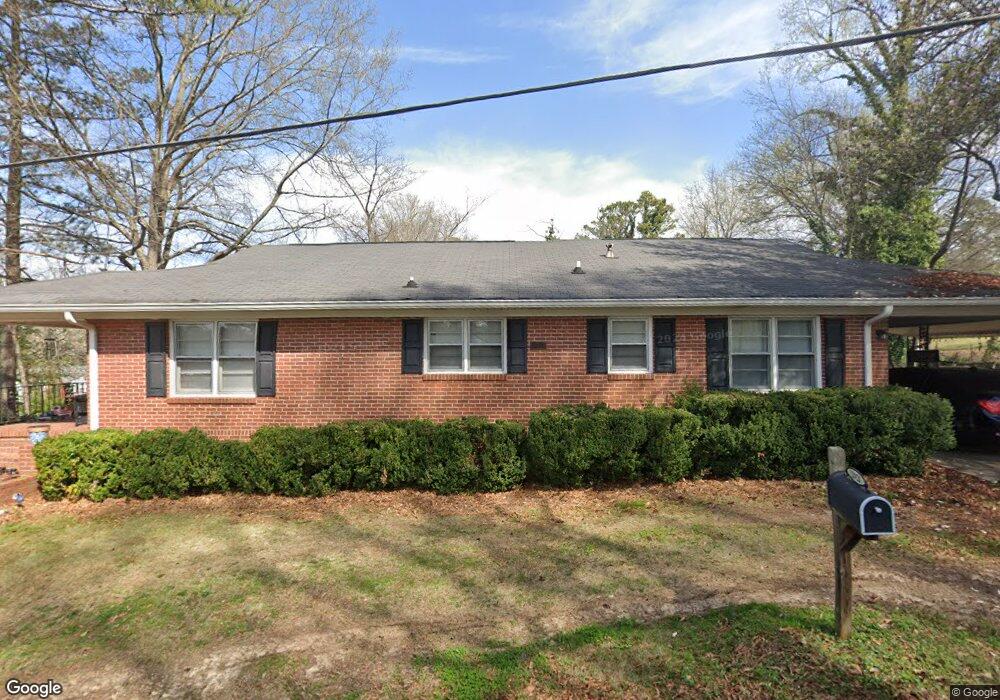
This home is located at 2921 Maple Rd SE, Rome, GA 30161 and is currently estimated at $222,774, approximately $122 per square foot. 2921 Maple Rd SE is a home located in Floyd County with nearby schools including Pepperell Middle School, Pepperell High School, and Montessori School of Rome.
Ownership History
Date
Name
Owned For
Owner Type
Purchase Details
Closed on
Feb 22, 2010
Sold by
Brown Alan
Bought by
Brown Lugina B
Current Estimated Value
Purchase Details
Closed on
Aug 4, 2006
Sold by
Not Provided
Bought by
Brown Lugina B
Home Financials for this Owner
Home Financials are based on the most recent Mortgage that was taken out on this home.
Original Mortgage
$120,000
Interest Rate
6.71%
Mortgage Type
New Conventional
Purchase Details
Closed on
Mar 22, 2001
Sold by
Brown Lugina B and Elsie Mcadams Estat
Bought by
Brown Lugina B
Purchase Details
Closed on
Dec 27, 2000
Bought by
P and R
Purchase Details
Closed on
Mar 28, 1985
Sold by
Mccarson Elsie
Bought by
Mcadams Elsie
Purchase Details
Closed on
Dec 31, 1979
Sold by
Mccarson Elsie and Blackmon Bobby F
Bought by
Mccarson Elsie
Purchase Details
Closed on
Jan 30, 1979
Sold by
Bradley Gessie Van Tassel Mrs Rw
Bought by
Mccarson Elsie and Blackmon Bobby F
Purchase Details
Closed on
Jan 1, 1901
Bought by
Bradley Gessie Van Tassel Mrs Rw
Create a Home Valuation Report for This Property
The Home Valuation Report is an in-depth analysis detailing your home's value as well as a comparison with similar homes in the area
Home Values in the Area
Average Home Value in this Area
Purchase History
| Date | Buyer | Sale Price | Title Company |
|---|---|---|---|
| Brown Lugina B | -- | -- | |
| Brown Lugina B | -- | -- | |
| Brown Lugina B | -- | -- | |
| Brown Lugina B | -- | -- | |
| P | -- | -- | |
| Brown Lugina B | -- | -- | |
| Mcadams Elsie | -- | -- | |
| Mccarson Elsie | -- | -- | |
| Mccarson Elsie | -- | -- | |
| Bradley Gessie Van Tassel Mrs Rw | -- | -- |
Source: Public Records
Mortgage History
| Date | Status | Borrower | Loan Amount |
|---|---|---|---|
| Previous Owner | Brown Lugina B | $120,000 |
Source: Public Records
Tax History Compared to Growth
Tax History
| Year | Tax Paid | Tax Assessment Tax Assessment Total Assessment is a certain percentage of the fair market value that is determined by local assessors to be the total taxable value of land and additions on the property. | Land | Improvement |
|---|---|---|---|---|
| 2024 | $2,569 | $79,620 | $5,454 | $74,166 |
| 2023 | $2,373 | $75,917 | $4,848 | $71,069 |
| 2022 | $1,955 | $62,648 | $4,040 | $58,608 |
| 2021 | $1,796 | $56,418 | $4,040 | $52,378 |
| 2020 | $1,441 | $52,275 | $3,030 | $49,245 |
| 2019 | $1,569 | $49,477 | $3,030 | $46,447 |
| 2018 | $1,474 | $46,352 | $3,030 | $43,322 |
| 2017 | $1,421 | $44,495 | $3,030 | $41,465 |
| 2016 | $1,402 | $43,304 | $3,000 | $40,304 |
| 2015 | $1,375 | $43,304 | $3,000 | $40,304 |
| 2014 | $1,375 | $43,304 | $3,000 | $40,304 |
Source: Public Records
Map
Nearby Homes
- 409 Flora Ave SE
- 3014 Maple Rd SE
- 2812 Maple Rd SE
- 2710 Maple Rd SE
- 226 Flora Ave SE
- 13 Spring Cir SE
- 212 Alfred Ave SE
- 211 Alfred Ave SE
- 106 Sunset Dr SE
- 36 Saddle Mountain Rd SE
- 33 Summit Dr
- 2523 Maple Rd SE
- 27 Saddle Mountain Rd SE
- 2508 Maple Rd SE
- 2501 Maple Rd SE
- 270 N Edenfield Ridge Dr SE
- 3 Belmont Ct SE
- 15 Saddlebrook Dr SE
- 0 Martha Berry Hwy Unit 7525627
- 0 Martha Berry Hwy Unit 7614774
- 2919 Maple Rd SE
- 3001 Maple Rd SE
- 340 Flora Ave SE
- 2917 Maple Rd SE
- 400 Flora Ave Extension SE
- 338 Flora Ave SE
- 400 Flora Ave Extension SE
- 3003 Maple Rd SE
- 2922 Maple Rd SE
- 2920 Maple Rd SE
- 2915 Maple Rd SE
- 413 Flora Ave SE
- 419 Flora Ave SE
- 336 Flora Ave SE
- 2918 Maple Rd SE
- 2918 Maple Rd SE
- 402 Flora Ave Extension SE
- 3005 Maple Rd SE
- 2916 Maple Rd SE
- 3002 Maple Rd SE