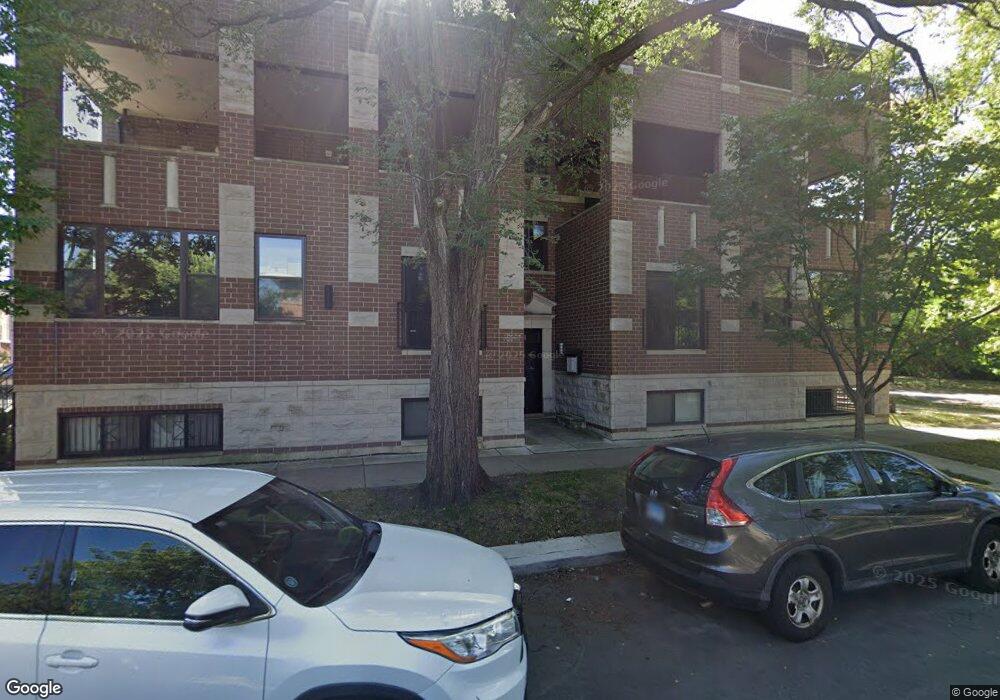
2921 W Glenlake Ave Unit 1E Chicago, IL 60659
West Ridge NeighborhoodEstimated Value: $325,000 - $455,000
3
Beds
2
Baths
2,000
Sq Ft
$191/Sq Ft
Est. Value
About This Home
This home is located at 2921 W Glenlake Ave Unit 1E, Chicago, IL 60659 and is currently estimated at $382,945, approximately $191 per square foot. 2921 W Glenlake Ave Unit 1E is a home located in Cook County with nearby schools including Clinton Elementary School, Mather High School, and Yeshivas Tiferes Tzvi Academy.
Ownership History
Date
Name
Owned For
Owner Type
Purchase Details
Closed on
Jan 27, 2012
Sold by
Loyola Properties Inc
Bought by
Adebanjo Isaac and Adebanjo Florence
Current Estimated Value
Home Financials for this Owner
Home Financials are based on the most recent Mortgage that was taken out on this home.
Original Mortgage
$154,335
Outstanding Balance
$105,634
Interest Rate
3.87%
Mortgage Type
FHA
Estimated Equity
$277,311
Purchase Details
Closed on
Sep 14, 2011
Sold by
Bb Development Iii Llc
Bought by
Loyola Properties Inc
Purchase Details
Closed on
Aug 26, 2011
Sold by
Mb Financial Bank Na
Bought by
Bb Development Iii Llc
Purchase Details
Closed on
Jun 22, 2011
Sold by
Glenlake Manor Llc
Bought by
Mb Financial Bank Na
Create a Home Valuation Report for This Property
The Home Valuation Report is an in-depth analysis detailing your home's value as well as a comparison with similar homes in the area
Home Values in the Area
Average Home Value in this Area
Purchase History
| Date | Buyer | Sale Price | Title Company |
|---|---|---|---|
| Adebanjo Isaac | $158,500 | Git | |
| Loyola Properties Inc | $800,000 | First American | |
| Bb Development Iii Llc | -- | None Available | |
| Mb Financial Bank Na | -- | None Available |
Source: Public Records
Mortgage History
| Date | Status | Borrower | Loan Amount |
|---|---|---|---|
| Open | Adebanjo Isaac | $154,335 |
Source: Public Records
Tax History Compared to Growth
Tax History
| Year | Tax Paid | Tax Assessment Tax Assessment Total Assessment is a certain percentage of the fair market value that is determined by local assessors to be the total taxable value of land and additions on the property. | Land | Improvement |
|---|---|---|---|---|
| 2024 | $5,630 | $34,118 | $3,611 | $30,507 |
| 2023 | $5,467 | $30,001 | $2,928 | $27,073 |
| 2022 | $5,467 | $30,001 | $2,928 | $27,073 |
| 2021 | $5,363 | $29,999 | $2,927 | $27,072 |
| 2020 | $3,690 | $19,665 | $1,756 | $17,909 |
| 2019 | $3,748 | $22,083 | $1,756 | $20,327 |
| 2018 | $3,684 | $22,083 | $1,756 | $20,327 |
| 2017 | $4,181 | $19,421 | $1,561 | $17,860 |
| 2016 | $3,890 | $19,421 | $1,561 | $17,860 |
| 2015 | $3,559 | $19,421 | $1,561 | $17,860 |
| 2014 | $3,181 | $17,147 | $1,463 | $15,684 |
| 2013 | $3,119 | $17,147 | $1,463 | $15,684 |
Source: Public Records
Map
Nearby Homes
- 6212 N Sacramento Ave
- 6214 N Mozart St Unit 3E
- 6226 N Mozart St Unit 2N
- 6235 N Mozart St
- 6210 N Albany Ave
- 6040 N Troy St Unit 306
- 5838 N Sacramento Ave
- 6215 N Washtenaw Ave
- 6312 N Fairfield Ave Unit 3B
- 5830 N Lincoln Ave Unit 2W
- 5830 N Lincoln Ave Unit 2E
- 5830 N Lincoln Ave Unit 3E
- 5830 N Lincoln Ave Unit 1E
- 5824 N Lincoln Ave Unit PH-3N
- 5824 N Lincoln Ave Unit GN
- 5824 N Lincoln Ave Unit 1N
- 5848 N Virginia Ave
- 6310 N Troy St
- 6400 N Sacramento Ave Unit 205
- 6215 N Talman Ave
- 2921 W Glenlake Ave
- 2921 W Glenlake Ave Unit 4W
- 2921 W Glenlake Ave Unit 4E
- 2921 W Glenlake Ave Unit 3W
- 2921 W Glenlake Ave Unit 3E
- 2921 W Glenlake Ave Unit 2S
- 2921 W Glenlake Ave Unit 2W
- 2921 W Glenlake Ave Unit 2E
- 2921 W Glenlake Ave Unit 1W
- 2921 W Glenlake Ave Unit 2
- 6049 N Richmond St
- 6054 N Francisco Ave
- 6045 N Richmond St
- 6045 N Richmond St
- 6058 N Francisco Ave
- 2911 W Glenlake Ave
- 2911 W Glenlake Ave
- 2911 W Glenlake Ave
- 2911 W Glenlake Ave Unit 2911
- 2907 W Glenlake Ave