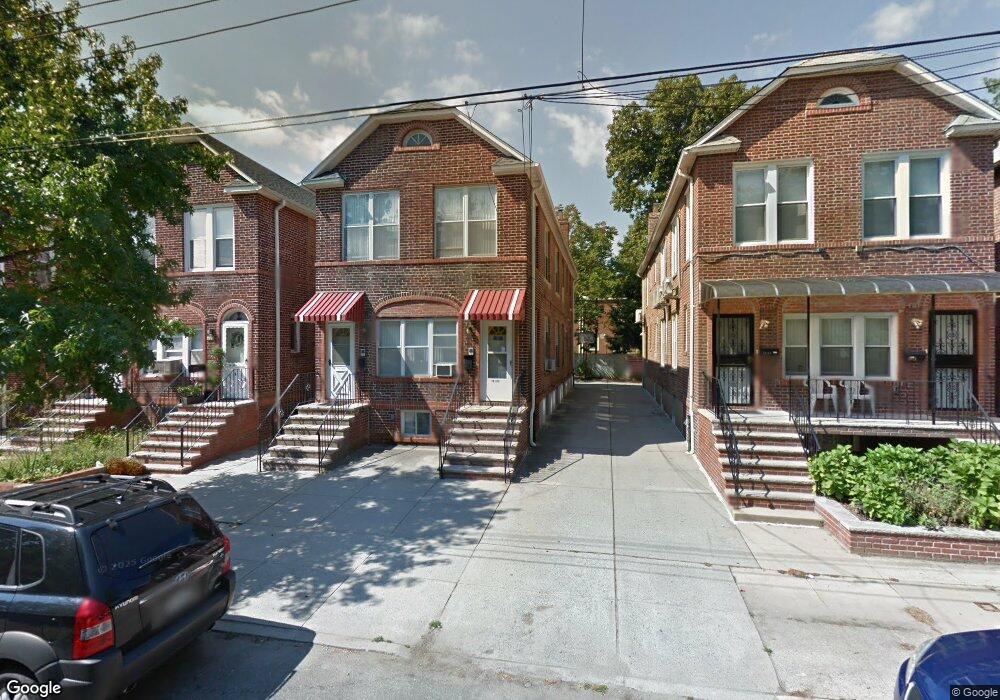
2922 164th St Flushing, NY 11358
Murray Hill-Broadway NeighborhoodEstimated Value: $1,192,000 - $1,579,000
Studio
--
Bath
2,480
Sq Ft
$578/Sq Ft
Est. Value
About This Home
This home is located at 2922 164th St, Flushing, NY 11358 and is currently estimated at $1,432,799, approximately $577 per square foot. 2922 164th St is a home located in Queens County with nearby schools including P.S. 32 - State Street, I.S. 25 Adrien Block, and Francis Lewis High School.
Ownership History
Date
Name
Owned For
Owner Type
Purchase Details
Closed on
Apr 3, 2007
Sold by
Marino Marijo A and Marino Paul V
Bought by
Chan Oi Ching
Current Estimated Value
Home Financials for this Owner
Home Financials are based on the most recent Mortgage that was taken out on this home.
Original Mortgage
$450,000
Outstanding Balance
$269,980
Interest Rate
6.19%
Mortgage Type
Purchase Money Mortgage
Estimated Equity
$1,162,819
Purchase Details
Closed on
Jan 2, 1996
Sold by
Marino Paul V
Bought by
Marino Paul and Marino Marijo A
Home Financials for this Owner
Home Financials are based on the most recent Mortgage that was taken out on this home.
Original Mortgage
$107,712
Interest Rate
7.1%
Create a Home Valuation Report for This Property
The Home Valuation Report is an in-depth analysis detailing your home's value as well as a comparison with similar homes in the area
Home Values in the Area
Average Home Value in this Area
Purchase History
| Date | Buyer | Sale Price | Title Company |
|---|---|---|---|
| Chan Oi Ching | $810,000 | -- | |
| Chan Oi Ching | $810,000 | -- | |
| Marino Paul | -- | -- | |
| Marino Paul V | -- | -- |
Source: Public Records
Mortgage History
| Date | Status | Borrower | Loan Amount |
|---|---|---|---|
| Open | Chan Oi Ching | $450,000 | |
| Closed | Chan Oi Ching | $450,000 | |
| Previous Owner | Marino Paul V | $107,712 |
Source: Public Records
Tax History
| Year | Tax Paid | Tax Assessment Tax Assessment Total Assessment is a certain percentage of the fair market value that is determined by local assessors to be the total taxable value of land and additions on the property. | Land | Improvement |
|---|---|---|---|---|
| 2025 | $5,570 | $56,753 | $15,866 | $40,887 |
| 2024 | $5,570 | $55,464 | $15,578 | $39,886 |
| 2023 | $10,535 | $52,454 | $13,259 | $39,195 |
| 2022 | $7,467 | $75,900 | $21,840 | $54,060 |
| 2021 | $9,953 | $79,080 | $21,840 | $57,240 |
| 2020 | $10,011 | $75,660 | $21,840 | $53,820 |
| 2019 | $9,669 | $77,160 | $21,840 | $55,320 |
| 2018 | $8,911 | $43,712 | $15,959 | $27,753 |
| 2017 | $8,472 | $41,560 | $16,734 | $24,826 |
| 2016 | $7,879 | $41,560 | $16,734 | $24,826 |
| 2015 | $4,729 | $39,412 | $19,324 | $20,088 |
| 2014 | $4,729 | $38,517 | $22,673 | $15,844 |
Source: Public Records
Map
Nearby Homes
Your Personal Tour Guide
Ask me questions while you tour the home.