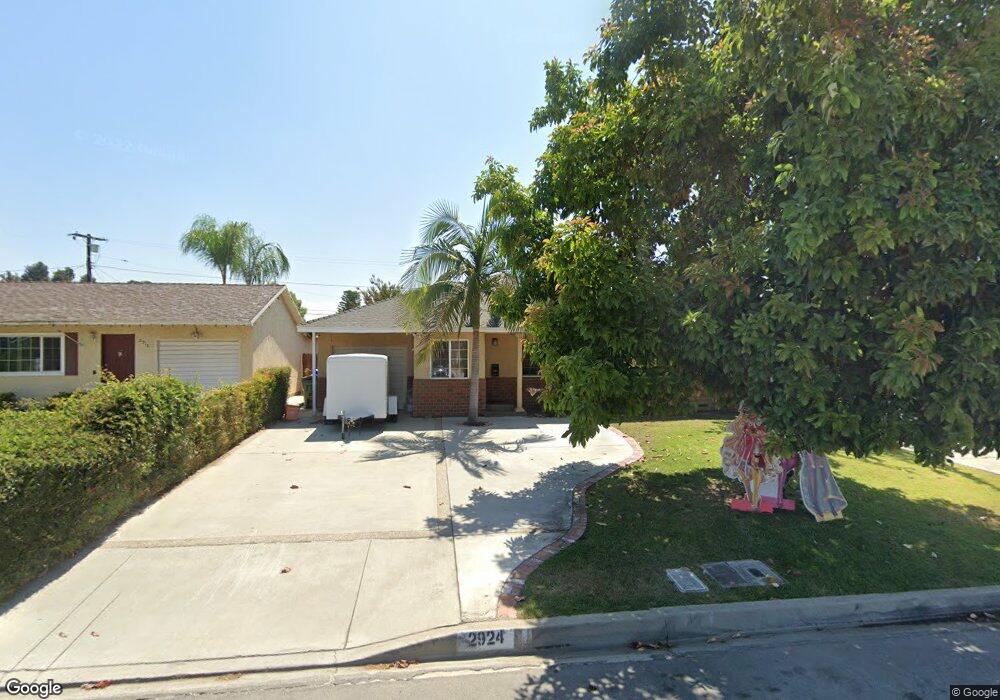
2924 Foss Ave Arcadia, CA 91006
Mayflower Village NeighborhoodEstimated Value: $787,000 - $1,150,000
3
Beds
2
Baths
1,672
Sq Ft
$594/Sq Ft
Est. Value
About This Home
This home is located at 2924 Foss Ave, Arcadia, CA 91006 and is currently estimated at $992,628, approximately $593 per square foot. 2924 Foss Ave is a home located in Los Angeles County with nearby schools including Plymouth Elementary School, Santa Fe Computer Science Magnet, and Monrovia High School.
Ownership History
Date
Name
Owned For
Owner Type
Purchase Details
Closed on
Feb 12, 2022
Sold by
Le Oetojo and Le Shirley
Bought by
H & S Oetojo Revocable Trust
Current Estimated Value
Purchase Details
Closed on
May 22, 2015
Sold by
Oetojo Harianto
Bought by
Oetojo Harianto and Yip Shirley Le
Purchase Details
Closed on
Dec 11, 2002
Sold by
Yip Shirley Le
Bought by
Oetojo Harianto
Home Financials for this Owner
Home Financials are based on the most recent Mortgage that was taken out on this home.
Original Mortgage
$199,200
Interest Rate
6.03%
Purchase Details
Closed on
Dec 10, 2002
Sold by
Wilson Allan R and Wilson Isabel
Bought by
Oetojo Harianto
Home Financials for this Owner
Home Financials are based on the most recent Mortgage that was taken out on this home.
Original Mortgage
$199,200
Interest Rate
6.03%
Create a Home Valuation Report for This Property
The Home Valuation Report is an in-depth analysis detailing your home's value as well as a comparison with similar homes in the area
Home Values in the Area
Average Home Value in this Area
Purchase History
| Date | Buyer | Sale Price | Title Company |
|---|---|---|---|
| H & S Oetojo Revocable Trust | -- | None Listed On Document | |
| Oetojo Harianto | -- | None Available | |
| Oetojo Harianto | -- | American Title Co | |
| Oetojo Harianto | $249,000 | American Title Co |
Source: Public Records
Mortgage History
| Date | Status | Borrower | Loan Amount |
|---|---|---|---|
| Previous Owner | Oetojo Harianto | $199,200 |
Source: Public Records
Tax History Compared to Growth
Tax History
| Year | Tax Paid | Tax Assessment Tax Assessment Total Assessment is a certain percentage of the fair market value that is determined by local assessors to be the total taxable value of land and additions on the property. | Land | Improvement |
|---|---|---|---|---|
| 2025 | $6,068 | $483,957 | $288,496 | $195,461 |
| 2024 | $6,068 | $474,469 | $282,840 | $191,629 |
| 2023 | $5,927 | $465,167 | $277,295 | $187,872 |
| 2022 | $5,750 | $456,047 | $271,858 | $184,189 |
| 2021 | $5,633 | $447,106 | $266,528 | $180,578 |
| 2019 | $5,358 | $433,847 | $258,624 | $175,223 |
| 2018 | $5,196 | $425,341 | $253,553 | $171,788 |
| 2016 | $4,986 | $408,826 | $243,708 | $165,118 |
| 2015 | $4,874 | $402,686 | $240,048 | $162,638 |
| 2014 | $4,830 | $394,799 | $235,346 | $159,453 |
Source: Public Records
Map
Nearby Homes
- 2938 Foss Ave
- 3016 S 9th Ave
- 4316 Marigold Ln
- 4268 Jasmine Ln
- 4258 Jasmine Ln
- 4226 Marigold Ln
- 6 Plan at Townhomes at Magnolia
- 7 Plan at Townhomes at Magnolia
- 1 Plan at Townhomes at Magnolia
- 2 Plan at Townhomes at Magnolia
- 3 Plan at Townhomes at Magnolia
- 4270 Jasmine Ln
- 916 Othello St
- 4262 Jasmine Ln
- 4256 Marigold Ln
- 4257 Jasmine Ln
- 4261 Jasmine Ln
- 4263 Jasmine Ln
- 4279 Jasmine Ln
- 4305 Jasmine Ln
- 2928 Foss Ave
- 2918 Foss Ave
- 2923 Weidermeyer Ave
- 2932 Foss Ave
- 2912 Foss Ave
- 2929 Weidermeyer Ave
- 2917 Weidermeyer Ave
- 2933 Weidermeyer Ave
- 2913 Weidermeyer Ave
- 2908 Foss Ave
- 2923 Foss Ave
- 2929 Foss Ave
- 2917 Foss Ave
- 2939 Weidermeyer Ave
- 2933 Foss Ave
- 2909 Weidermeyer Ave
- 2913 Foss Ave
- 2902 Foss Ave
- 905 E Sandra Ave
- 2939 Foss Ave