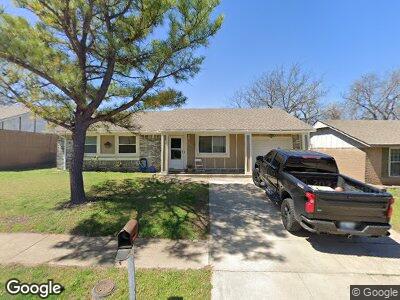
2926 S 131st East Ave Tulsa, OK 74134
Eastpark NeighborhoodEstimated Value: $142,000 - $158,494
--
Bed
2
Baths
1,084
Sq Ft
$140/Sq Ft
Est. Value
About This Home
This home is located at 2926 S 131st East Ave, Tulsa, OK 74134 and is currently estimated at $151,874, approximately $140 per square foot. 2926 S 131st East Ave is a home located in Tulsa County with nearby schools including Disney Elementary School, East Central High School, and Dove Science Academy Tulsa.
Ownership History
Date
Name
Owned For
Owner Type
Purchase Details
Closed on
Feb 21, 2025
Sold by
Angulo Angelica Felix and Aguilar Juan L
Bought by
Gomez Santiago and Huerta Yazmin Gomez
Current Estimated Value
Purchase Details
Closed on
Dec 21, 2018
Sold by
Mora Roberto Carbajal
Bought by
Angulo Angelica Felix
Purchase Details
Closed on
Jan 23, 2006
Sold by
Hud
Bought by
Mora Roberto Carbajal
Home Financials for this Owner
Home Financials are based on the most recent Mortgage that was taken out on this home.
Original Mortgage
$57,600
Interest Rate
6.24%
Mortgage Type
Fannie Mae Freddie Mac
Purchase Details
Closed on
Mar 30, 2000
Sold by
Ennis Kim Leslie and Ennis Beverly
Bought by
Hayes Robert E and Hayes Tosha Y
Home Financials for this Owner
Home Financials are based on the most recent Mortgage that was taken out on this home.
Original Mortgage
$66,865
Interest Rate
8.33%
Mortgage Type
FHA
Create a Home Valuation Report for This Property
The Home Valuation Report is an in-depth analysis detailing your home's value as well as a comparison with similar homes in the area
Home Values in the Area
Average Home Value in this Area
Purchase History
| Date | Buyer | Sale Price | Title Company |
|---|---|---|---|
| Gomez Santiago | $100,000 | None Listed On Document | |
| Angulo Angelica Felix | -- | None Available | |
| Mora Roberto Carbajal | -- | First American Title & Abstr | |
| Hayes Robert E | $67,000 | -- |
Source: Public Records
Mortgage History
| Date | Status | Borrower | Loan Amount |
|---|---|---|---|
| Previous Owner | Angulo Angelica Felix | $60,000 | |
| Previous Owner | Mora Roberto Carbajal | $57,600 | |
| Previous Owner | Hayes Robert E | $66,865 |
Source: Public Records
Tax History Compared to Growth
Tax History
| Year | Tax Paid | Tax Assessment Tax Assessment Total Assessment is a certain percentage of the fair market value that is determined by local assessors to be the total taxable value of land and additions on the property. | Land | Improvement |
|---|---|---|---|---|
| 2024 | $1,154 | $9,544 | $1,339 | $8,205 |
| 2023 | $1,154 | $9,090 | $1,392 | $7,698 |
| 2022 | $1,154 | $8,656 | $1,917 | $6,739 |
| 2021 | $1,089 | $8,244 | $1,826 | $6,418 |
| 2020 | $1,074 | $8,244 | $1,826 | $6,418 |
| 2019 | $1,130 | $8,244 | $1,826 | $6,418 |
| 2018 | $1,119 | $8,150 | $1,805 | $6,345 |
| 2017 | $1,064 | $7,762 | $1,719 | $6,043 |
| 2016 | $992 | $7,392 | $1,637 | $5,755 |
| 2015 | $947 | $7,040 | $1,826 | $5,214 |
| 2014 | $938 | $7,040 | $1,826 | $5,214 |
Source: Public Records
Map
Nearby Homes
- 13061 E 28th Place
- 12802 E 31st Ct
- 13332 E 32nd Place
- 12634 E 31st Place
- 2925 S 125th Ave E
- 2415 S 133rd Ave E
- 12939 E 34th St
- 2703 S 137th Ave E
- 12924 E 34th St
- 3225 S 126th Ave E
- 3307 S 137th Ave E
- 3249 S 138th Ave E
- 12131 E 31st Place
- 12635 E 34th St
- 12518 E 25th St
- 2721 S 121st Ave E
- 14101 E 33rd St
- 12442 E 34th St S
- 12013 E 27th St
- 14139 E 26th St
- 2926 S 131st East Ave
- 2926 S 131st Ave E
- 2930 S 131st East Ave
- 2920 S 131st East Ave
- 2912 S 131st East Ave
- 2934 S 131st East Ave
- 2925 S 131st East Ave
- 2929 S 131st East Ave
- 2919 S 131st East Ave
- 2908 S 131st Ave E
- 2908 S 131st East Ave
- 2940 S 131st Ave E
- 2940 S 131st East Ave
- 2933 S 131st East Ave
- 2911 S 131st East Ave
- 13111 E 30th St
- 2916 S 131st East Place
- 2904 S 131st East Ave
- 13110 E 29th St
- 2922 S 131st East Place