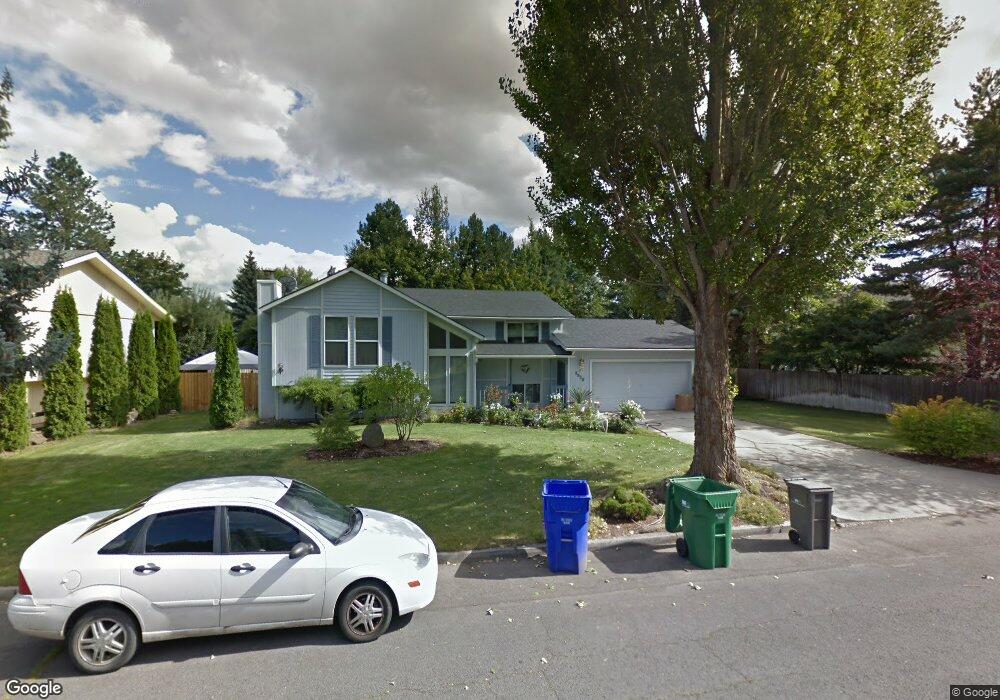
2928 E 62nd Ave Spokane, WA 99223
Moran Prairie NeighborhoodEstimated Value: $454,019 - $535,000
3
Beds
3
Baths
2,286
Sq Ft
$215/Sq Ft
Est. Value
About This Home
This home is located at 2928 E 62nd Ave, Spokane, WA 99223 and is currently estimated at $490,505, approximately $214 per square foot. 2928 E 62nd Ave is a home located in Spokane County with nearby schools including Mullan Road Elementary School, Sacajawea Middle School, and Ferris High School.
Ownership History
Date
Name
Owned For
Owner Type
Purchase Details
Closed on
May 18, 2005
Sold by
Jones Justin R and Jones Krysten D
Bought by
Jazic Fahrudin and Jazic Meleca
Current Estimated Value
Home Financials for this Owner
Home Financials are based on the most recent Mortgage that was taken out on this home.
Original Mortgage
$177,000
Outstanding Balance
$92,467
Interest Rate
5.87%
Mortgage Type
New Conventional
Estimated Equity
$398,038
Purchase Details
Closed on
May 25, 2001
Sold by
Fuller Rodney C and Fuller Roberta G
Bought by
Jones Justin R and Jones Krysten D
Home Financials for this Owner
Home Financials are based on the most recent Mortgage that was taken out on this home.
Original Mortgage
$131,640
Interest Rate
7.06%
Mortgage Type
FHA
Purchase Details
Closed on
Dec 11, 1998
Sold by
Martin Scott H and Martin Libby M
Bought by
Fuller Rodney C and Fuller Roberta G
Home Financials for this Owner
Home Financials are based on the most recent Mortgage that was taken out on this home.
Original Mortgage
$116,437
Interest Rate
6.86%
Mortgage Type
VA
Create a Home Valuation Report for This Property
The Home Valuation Report is an in-depth analysis detailing your home's value as well as a comparison with similar homes in the area
Home Values in the Area
Average Home Value in this Area
Purchase History
| Date | Buyer | Sale Price | Title Company |
|---|---|---|---|
| Jazic Fahrudin | $177,500 | First American Title Ins | |
| Jones Justin R | $133,500 | Pioneer Title Company | |
| Fuller Rodney C | $130,000 | First American Title Ins |
Source: Public Records
Mortgage History
| Date | Status | Borrower | Loan Amount |
|---|---|---|---|
| Open | Jazic Fahrudin | $177,000 | |
| Previous Owner | Jones Justin R | $131,640 | |
| Previous Owner | Fuller Rodney C | $116,437 |
Source: Public Records
Tax History
| Year | Tax Paid | Tax Assessment Tax Assessment Total Assessment is a certain percentage of the fair market value that is determined by local assessors to be the total taxable value of land and additions on the property. | Land | Improvement |
|---|---|---|---|---|
| 2025 | $4,273 | $411,100 | $110,000 | $301,100 |
| 2024 | $4,273 | $408,900 | $95,000 | $313,900 |
| 2023 | $3,849 | $396,600 | $85,000 | $311,600 |
| 2022 | $3,869 | $377,500 | $75,000 | $302,500 |
| 2021 | $3,444 | $280,200 | $60,000 | $220,200 |
| 2020 | $3,133 | $244,900 | $55,000 | $189,900 |
| 2019 | $2,707 | $215,100 | $45,000 | $170,100 |
| 2018 | $2,967 | $201,400 | $45,000 | $156,400 |
| 2017 | $2,750 | $188,400 | $42,000 | $146,400 |
| 2016 | $2,520 | $169,000 | $42,000 | $127,000 |
| 2015 | $2,428 | $164,400 | $42,000 | $122,400 |
| 2014 | -- | $153,500 | $40,000 | $113,500 |
| 2013 | -- | $0 | $0 | $0 |
Source: Public Records
Map
Nearby Homes
- 2920 E 62nd Ave
- 6315 S Moran Dr
- 3514 E 61st Ave
- 3326 E 55th Ave
- 6018 S Stone St
- 2215 E 58th Ct
- 2106 E 63rd Ave
- 2209 E 52nd Ln
- 6111 S Pittsburg St
- 1718 E 60th Ave
- 1804 E 63rd Ave
- 3408 E 48th Ct
- 2202 E 50th Ave
- 1607 E 63rd Ave
- 4517 S Sheri Ct Unit C
- 4503 S Sheri Ct Unit 2
- 1504 E 64th Ave
- 1602 E 53rd Ave
- 5915 S Dearborn Rd
- 5110 S Glenngrae Ct
- 3006 E Angela Ct
- 2916 E 62nd Ave
- 2925 E 62nd Ave
- 3005 E 62nd Ave
- 3014 E 62nd Ave
- 3007 E Angela Ct
- 3012 E Angela Ct
- 2912 E 62nd Ave
- 2918 E 61st Ct
- 2921 E 62nd Ave
- 2915 E 62nd Ave
- 3013 E Angela Ct
- 3106 E 62nd Ave
- 2910 E 62nd Ave
- 3009 E 62nd Ave
- 3018 E Angela Ct
- 3110 E 62nd Ave
- 3021 E 62nd Ave
- 6308 S Deanna Ct
- 2912 E 61st Ct
Your Personal Tour Guide
Ask me questions while you tour the home.