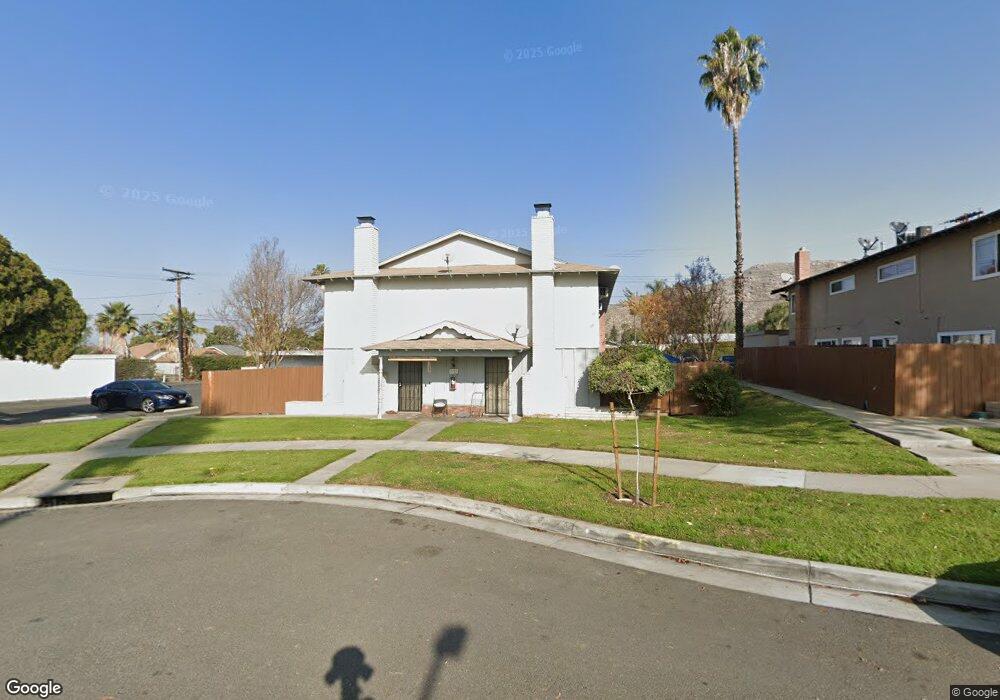
2929 Elgin Dr Unit C Riverside, CA 92507
University NeighborhoodEstimated Value: $1,137,000 - $1,401,000
2
Beds
2
Baths
1,000
Sq Ft
$1,246/Sq Ft
Est. Value
About This Home
This home is located at 2929 Elgin Dr Unit C, Riverside, CA 92507 and is currently estimated at $1,245,827, approximately $1,245 per square foot. 2929 Elgin Dr Unit C is a home located in Riverside County with nearby schools including Highland Elementary, University Heights Middle School, and John W. North High School.
Ownership History
Date
Name
Owned For
Owner Type
Purchase Details
Closed on
Jul 6, 2022
Sold by
Salvador Hernandez
Bought by
Hernandez-Gutierrez Family Living Trust
Current Estimated Value
Purchase Details
Closed on
Dec 20, 2021
Sold by
Gutierrez Monica
Bought by
Hernandez Salvador
Home Financials for this Owner
Home Financials are based on the most recent Mortgage that was taken out on this home.
Original Mortgage
$698,500
Interest Rate
2.98%
Mortgage Type
New Conventional
Purchase Details
Closed on
Dec 11, 2021
Sold by
Yeh Doug K and Luong Sylvia
Bought by
Hernandez Salvador
Home Financials for this Owner
Home Financials are based on the most recent Mortgage that was taken out on this home.
Original Mortgage
$698,500
Interest Rate
2.98%
Mortgage Type
New Conventional
Purchase Details
Closed on
Oct 26, 2011
Sold by
Yeh Doug and Luong Sylvia
Bought by
Yeh Doug K and Luong Sylvia
Purchase Details
Closed on
Aug 18, 2010
Sold by
The Bank Of New York Mellon
Bought by
Yeh Doug and Luong Sylvia
Home Financials for this Owner
Home Financials are based on the most recent Mortgage that was taken out on this home.
Original Mortgage
$200,000
Interest Rate
4.21%
Mortgage Type
Commercial
Purchase Details
Closed on
May 19, 2010
Sold by
Brooks John W
Bought by
The Bank Of New York Mellon
Purchase Details
Closed on
Feb 17, 2006
Sold by
Kenzy Douglas L and Kenzy Janice M
Bought by
Brooks John W
Home Financials for this Owner
Home Financials are based on the most recent Mortgage that was taken out on this home.
Original Mortgage
$479,500
Interest Rate
7.5%
Mortgage Type
Negative Amortization
Purchase Details
Closed on
Jan 5, 2001
Sold by
Aplin Reese
Bought by
Kenzy Douglas L and Kenzy Janice M
Home Financials for this Owner
Home Financials are based on the most recent Mortgage that was taken out on this home.
Original Mortgage
$138,750
Interest Rate
9.02%
Mortgage Type
Commercial
Purchase Details
Closed on
Sep 25, 1995
Sold by
Panacea Investment Corp
Bought by
Aplin Reese
Home Financials for this Owner
Home Financials are based on the most recent Mortgage that was taken out on this home.
Original Mortgage
$138,139
Interest Rate
7.8%
Mortgage Type
FHA
Purchase Details
Closed on
May 25, 1995
Sold by
Emc Mtg Corp
Bought by
Panacea Investment Corp
Purchase Details
Closed on
Aug 20, 1993
Sold by
California Loan Partners Lp
Bought by
Emc Mtg Corp
Create a Home Valuation Report for This Property
The Home Valuation Report is an in-depth analysis detailing your home's value as well as a comparison with similar homes in the area
Home Values in the Area
Average Home Value in this Area
Purchase History
| Date | Buyer | Sale Price | Title Company |
|---|---|---|---|
| Hernandez-Gutierrez Family Living Trust | -- | Hernandez | |
| Hernandez Salvador | -- | Clearmark Title Company | |
| Hernandez Salvador | $1,080,000 | Clearmark Title Company | |
| Yeh Doug K | -- | None Available | |
| Yeh Doug | $400,000 | Landsafe Title | |
| The Bank Of New York Mellon | $357,750 | Landsafe Title | |
| Brooks John W | $685,000 | United Title Company | |
| Kenzy Douglas L | $185,000 | First American Title Co | |
| Aplin Reese | $138,500 | Fidelity National Title Ins | |
| Panacea Investment Corp | $80,000 | Fidelity National Title Ins | |
| Emc Mtg Corp | -- | Fidelity National Title | |
| California Loan Partners Lp | -- | Fidelity National Title |
Source: Public Records
Mortgage History
| Date | Status | Borrower | Loan Amount |
|---|---|---|---|
| Previous Owner | Hernandez Salvador | $698,500 | |
| Previous Owner | Yeh Doug | $200,000 | |
| Previous Owner | Brooks John W | $479,500 | |
| Previous Owner | Kenzy Douglas L | $138,750 | |
| Previous Owner | Aplin Reese | $138,139 |
Source: Public Records
Tax History
| Year | Tax Paid | Tax Assessment Tax Assessment Total Assessment is a certain percentage of the fair market value that is determined by local assessors to be the total taxable value of land and additions on the property. | Land | Improvement |
|---|---|---|---|---|
| 2025 | $12,467 | $1,146,104 | $191,017 | $955,087 |
| 2023 | $12,467 | $1,101,600 | $183,600 | $918,000 |
| 2022 | $12,184 | $1,080,000 | $180,000 | $900,000 |
| 2021 | $5,469 | $473,428 | $118,352 | $355,076 |
| 2020 | $5,428 | $468,575 | $117,139 | $351,436 |
| 2019 | $5,328 | $459,389 | $114,843 | $344,546 |
| 2018 | $5,225 | $450,383 | $112,593 | $337,790 |
| 2017 | $5,134 | $441,553 | $110,386 | $331,167 |
| 2016 | $4,810 | $432,896 | $108,222 | $324,674 |
| 2015 | $4,742 | $426,397 | $106,598 | $319,799 |
| 2014 | $4,697 | $418,047 | $104,511 | $313,536 |
Source: Public Records
Map
Nearby Homes
- 2891 Canyon Crest Dr Unit 68
- 2891 Canyon Crest Dr Unit 32
- 1065 Bascomb Dr
- 1130 W Blaine St Unit 204
- 658 Glenhill Dr
- 2510 Cloudcrest Way
- 1305 Massachusetts Ave Unit 205
- 587 W Blaine St
- 1317 Massachusetts Ave Unit 202
- 1329 Massachusetts Ave Unit 202
- 1333 Massachusetts Ave Unit 201
- 1341 Massachusetts Ave Unit 101
- 36 Round Table Dr
- 104 Sir Tristram Dr Unit 104
- 1390 Clemson Way
- 461 W Blaine St
- 1560 Massachusetts Ave Unit 123
- 1560 Massachusetts Ave
- 1560 Massachusetts Ave Unit 96
- 1560 Massachusetts Ave Unit 46
- 2929 Elgin Dr Unit A
- 2929 Elgin Dr Unit A-D
- 2929 Elgin Dr
- 2939 Elgin Dr
- 2919 Elgin Dr
- 2909 Elgin Dr Unit D
- 2909 Elgin Dr Unit B
- 2909 Elgin Dr Unit A
- 2909 Elgin Dr
- 2963 Elgin Dr Unit D
- 2963 Elgin Dr Unit C
- 2963 Elgin Dr
- 2969 Canyon Crest Dr
- 1000 Massachusetts Ave
- 2981 Elgin Dr
- 2989 Canyon Crest Dr
- 2874 Don Goodwin Dr
- 1002 Massachusetts Ave
- 2934 Canyon Crest Dr
- 2934 Canyon Crest Dr
Your Personal Tour Guide
Ask me questions while you tour the home.