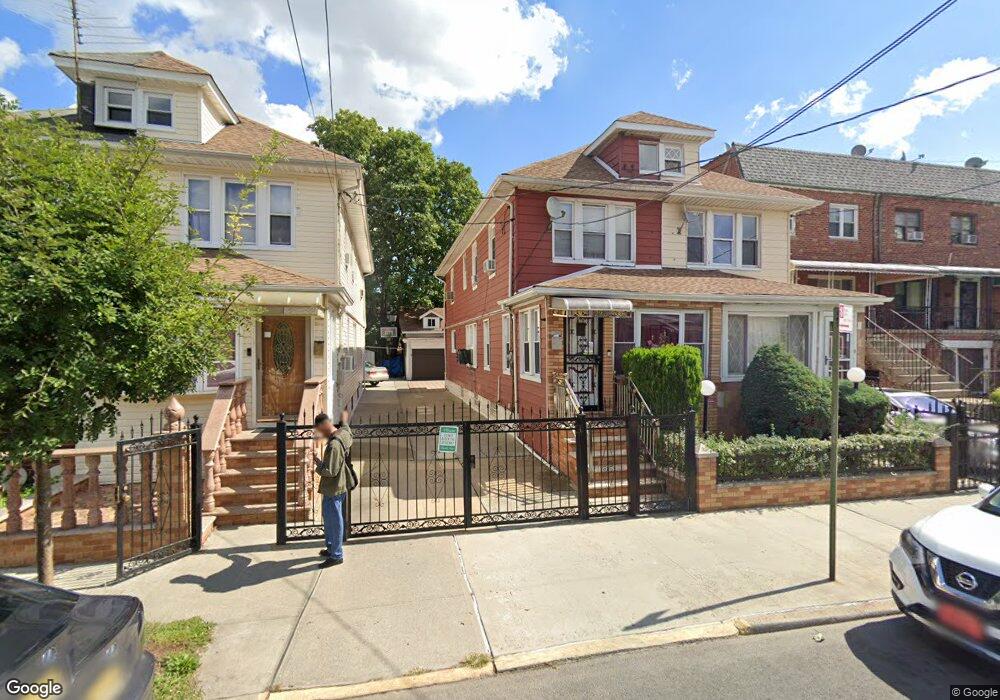
293 E 39th St Brooklyn, NY 11203
East Flatbush NeighborhoodEstimated Value: $619,113 - $755,000
Studio
--
Bath
1,326
Sq Ft
$525/Sq Ft
Est. Value
About This Home
This home is located at 293 E 39th St, Brooklyn, NY 11203 and is currently estimated at $695,528, approximately $524 per square foot. 293 E 39th St is a home located in Kings County with nearby schools including PS 235 Janice Marie Knight School, East Flatbush Community Research School, and East Flatbush Ascend Charter School.
Ownership History
Date
Name
Owned For
Owner Type
Purchase Details
Closed on
Mar 17, 2003
Sold by
Ince Myrthland
Bought by
Ince Claude
Current Estimated Value
Home Financials for this Owner
Home Financials are based on the most recent Mortgage that was taken out on this home.
Original Mortgage
$158,000
Interest Rate
5.8%
Mortgage Type
Purchase Money Mortgage
Create a Home Valuation Report for This Property
The Home Valuation Report is an in-depth analysis detailing your home's value as well as a comparison with similar homes in the area
Home Values in the Area
Average Home Value in this Area
Purchase History
| Date | Buyer | Sale Price | Title Company |
|---|---|---|---|
| Ince Claude | -- | -- | |
| Ince Claude | -- | -- |
Source: Public Records
Mortgage History
| Date | Status | Borrower | Loan Amount |
|---|---|---|---|
| Closed | Ince Claude | $158,000 |
Source: Public Records
Tax History
| Year | Tax Paid | Tax Assessment Tax Assessment Total Assessment is a certain percentage of the fair market value that is determined by local assessors to be the total taxable value of land and additions on the property. | Land | Improvement |
|---|---|---|---|---|
| 2025 | $5,245 | $39,000 | $12,540 | $26,460 |
| 2024 | $5,245 | $41,880 | $12,540 | $29,340 |
| 2023 | $5,252 | $40,920 | $12,540 | $28,380 |
| 2022 | $3,636 | $38,160 | $12,540 | $25,620 |
| 2021 | $4,816 | $40,680 | $12,540 | $28,140 |
| 2020 | $2,292 | $37,800 | $12,540 | $25,260 |
| 2019 | $4,504 | $30,960 | $12,540 | $18,420 |
| 2018 | $4,334 | $22,719 | $8,875 | $13,844 |
| 2017 | $4,070 | $21,436 | $9,635 | $11,801 |
| 2016 | $3,737 | $20,242 | $9,978 | $10,264 |
| 2015 | $2,219 | $19,440 | $13,920 | $5,520 |
| 2014 | $2,219 | $19,108 | $13,352 | $5,756 |
Source: Public Records
Map
Nearby Homes
- 282 E 38th St
- 278 E 37th St
- 266 E 37th St
- 935 Brooklyn Ave
- 4017 Church Ave Unit BUILDING
- 201 E 35th St
- 200 E 39th St
- 3500 Snyder Ave Unit 4V
- 3500 Snyder Ave Unit 2P
- 3500 Snyder Ave Unit 6A
- 3500 Snyder Ave Unit 6G
- 3500 Snyder Ave Unit 5C
- 230 E 42nd St
- 234 E 42nd St
- 902 Brooklyn Ave
- 202 E 35th St
- 285 E 35th St Unit 4B
- 285 E 35th St Unit 6K
- 285 E 35th St Unit 6E
- 285 E 35th St Unit 7J
- 295 E 39th St
- 289 E 39th St
- 297 E 39th St
- 287 E 39th St
- 299 E 39th St
- 299 E 39th St Unit HOUSE
- 301 E 39th St
- 283 E 39th St
- 283 E 39th St Unit 2
- 283 E 39th St Unit 1FL
- 305 E 39th St
- 288 E 40th St
- 290 E 40th St
- 286 E 40th St
- 292 E 40th St
- 284 E 40th St
- 279 E 39th St
- 307 E 39th St
- 300 E 40th St
- 300 E 40th St Unit 1
Your Personal Tour Guide
Ask me questions while you tour the home.