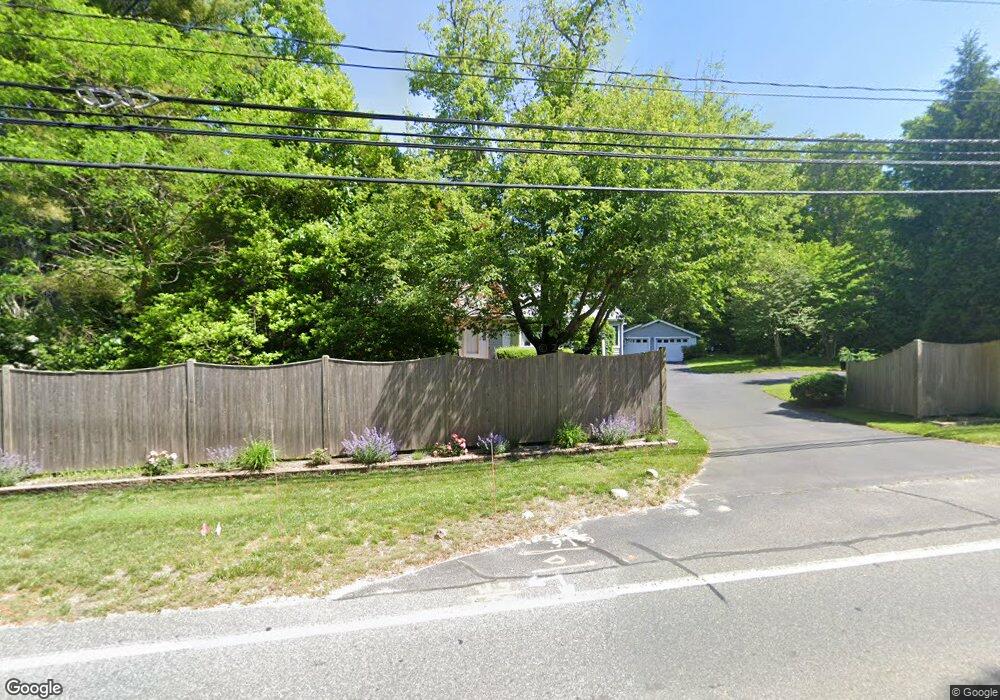
293 Main St Mashpee, MA 02649
Estimated Value: $688,000 - $766,883
3
Beds
2
Baths
1,901
Sq Ft
$384/Sq Ft
Est. Value
About This Home
This home is located at 293 Main St, Mashpee, MA 02649 and is currently estimated at $729,221, approximately $383 per square foot. 293 Main St is a home located in Barnstable County with nearby schools including Kenneth C. Coombs School, Quashnet School, and Mashpee Middle School.
Ownership History
Date
Name
Owned For
Owner Type
Purchase Details
Closed on
Mar 14, 2011
Sold by
Mckinney Amanda M
Bought by
Louzan Robert and Pacheco Susan
Current Estimated Value
Home Financials for this Owner
Home Financials are based on the most recent Mortgage that was taken out on this home.
Original Mortgage
$208,000
Outstanding Balance
$143,186
Interest Rate
4.83%
Mortgage Type
Purchase Money Mortgage
Estimated Equity
$586,035
Purchase Details
Closed on
Jul 24, 2008
Sold by
Mckinney Amanda M and Mckinney George G
Bought by
Mckinney Amanda M
Create a Home Valuation Report for This Property
The Home Valuation Report is an in-depth analysis detailing your home's value as well as a comparison with similar homes in the area
Purchase History
| Date | Buyer | Sale Price | Title Company |
|---|---|---|---|
| Louzan Robert | $260,000 | -- | |
| Mckinney Amanda M | -- | -- |
Source: Public Records
Mortgage History
| Date | Status | Borrower | Loan Amount |
|---|---|---|---|
| Open | Louzan Robert | $208,000 |
Source: Public Records
Tax History
| Year | Tax Paid | Tax Assessment Tax Assessment Total Assessment is a certain percentage of the fair market value that is determined by local assessors to be the total taxable value of land and additions on the property. | Land | Improvement |
|---|---|---|---|---|
| 2025 | $4,181 | $631,500 | $214,600 | $416,900 |
| 2024 | $3,839 | $597,000 | $195,100 | $401,900 |
| 2023 | $3,605 | $514,300 | $185,800 | $328,500 |
| 2022 | $3,511 | $429,700 | $159,500 | $270,200 |
| 2021 | $3,350 | $369,300 | $143,700 | $225,600 |
| 2020 | $3,235 | $355,900 | $138,200 | $217,700 |
| 2019 | $3,088 | $341,200 | $138,200 | $203,000 |
| 2018 | $2,504 | $332,400 | $138,200 | $194,200 |
| 2017 | $2,932 | $319,000 | $142,200 | $176,800 |
| 2016 | $2,841 | $307,500 | $142,200 | $165,300 |
| 2015 | $2,733 | $300,000 | $142,200 | $157,800 |
| 2014 | $2,515 | $267,800 | $115,000 | $152,800 |
Source: Public Records
Map
Nearby Homes
- 235 Main St
- 20 Lakewood Dr
- 45 Pequot Rd
- 45 Fox Hill Rd
- 173 Main St
- 16 Balfour Ln
- 22 Candlewood Ln
- 68 Fox Hill Rd
- 35 Claulise Ln
- 10 Candlewood Ln
- 22 Stratford Ridge Unit 22
- 52 Old Colony Dr
- 4 Bishops Park
- 63 Deer Ridge Rd
- 544 Cotuit Rd
- 16 Spring Brook Ln
- 10 Butler Ln
- 195 Falmouth Rd Unit 19F
- 195 Falmouth Rd Unit 9F
- 195 Falmouth Rd Unit 9F
Your Personal Tour Guide
Ask me questions while you tour the home.