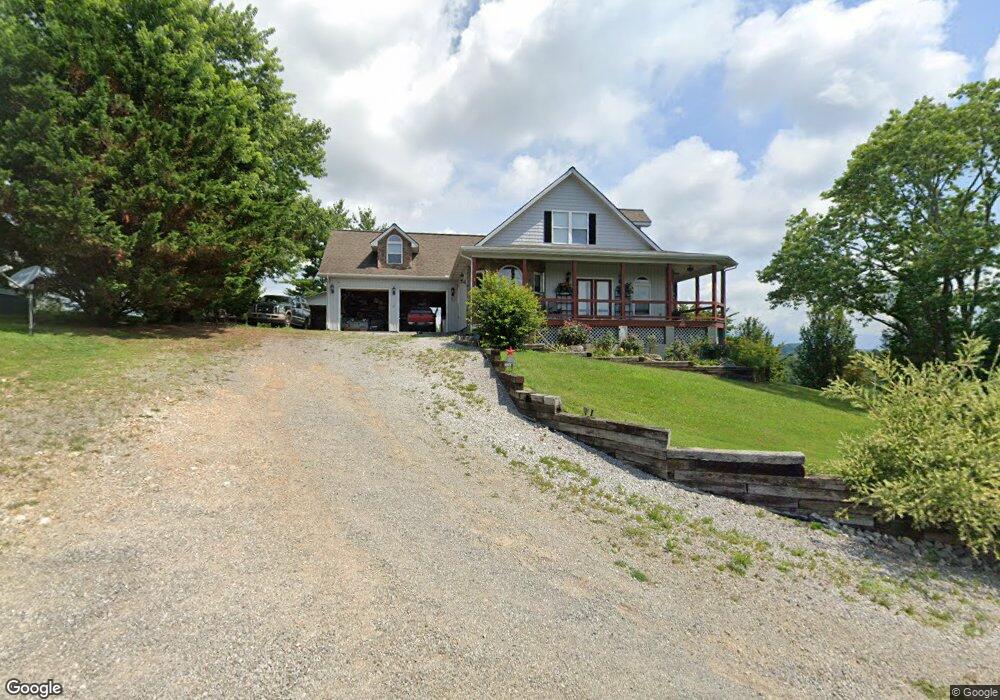
293 Mockingbird Cir Harrogate, TN 37752
Estimated Value: $306,000 - $391,000
4
Beds
4
Baths
4,400
Sq Ft
$80/Sq Ft
Est. Value
About This Home
This home is located at 293 Mockingbird Cir, Harrogate, TN 37752 and is currently estimated at $354,000, approximately $80 per square foot. 293 Mockingbird Cir is a home located in Claiborne County with nearby schools including Tri-State Christian Academy and J. Frank White Academy.
Ownership History
Date
Name
Owned For
Owner Type
Purchase Details
Closed on
Dec 18, 2014
Sold by
Brooks Jeffery O
Bought by
Shook Rusty and Shook Sally
Current Estimated Value
Purchase Details
Closed on
Dec 8, 2005
Sold by
Peters Violet
Bought by
Shook Joseph Russell
Home Financials for this Owner
Home Financials are based on the most recent Mortgage that was taken out on this home.
Original Mortgage
$150,000
Interest Rate
6.23%
Purchase Details
Closed on
Dec 1, 2005
Sold by
Peters Everett and Peters Violet
Bought by
Shook Joseph R
Home Financials for this Owner
Home Financials are based on the most recent Mortgage that was taken out on this home.
Original Mortgage
$150,000
Interest Rate
6.23%
Purchase Details
Closed on
Dec 1, 2004
Sold by
Taylor Charles
Bought by
Taylor Clarence B
Purchase Details
Closed on
Jan 8, 1988
Bought by
Chadwell Johnny E and Chadwell Linda K
Purchase Details
Closed on
Feb 23, 1977
Bought by
Peters Everett and Peters Violet
Create a Home Valuation Report for This Property
The Home Valuation Report is an in-depth analysis detailing your home's value as well as a comparison with similar homes in the area
Home Values in the Area
Average Home Value in this Area
Purchase History
| Date | Buyer | Sale Price | Title Company |
|---|---|---|---|
| Shook Rusty | $25,000 | -- | |
| Shook Joseph Russell | $20,000 | -- | |
| Shook Joseph R | $20,000 | -- | |
| Taylor Clarence B | $2,500 | -- | |
| Chadwell Johnny E | -- | -- | |
| Peters Everett | -- | -- |
Source: Public Records
Mortgage History
| Date | Status | Borrower | Loan Amount |
|---|---|---|---|
| Previous Owner | Peters Everett | $150,000 | |
| Previous Owner | Peters Everett | $150,000 |
Source: Public Records
Tax History Compared to Growth
Tax History
| Year | Tax Paid | Tax Assessment Tax Assessment Total Assessment is a certain percentage of the fair market value that is determined by local assessors to be the total taxable value of land and additions on the property. | Land | Improvement |
|---|---|---|---|---|
| 2024 | $1,302 | $55,650 | $2,900 | $52,750 |
| 2023 | $1,302 | $55,650 | $2,900 | $52,750 |
| 2022 | $1,113 | $55,650 | $2,900 | $52,750 |
| 2021 | $1,388 | $53,850 | $2,425 | $51,425 |
| 2020 | $1,388 | $53,850 | $2,425 | $51,425 |
| 2019 | $1,388 | $53,850 | $2,425 | $51,425 |
| 2018 | $1,388 | $53,850 | $2,425 | $51,425 |
| 2017 | $1,388 | $53,850 | $2,425 | $51,425 |
| 2016 | $1,459 | $56,550 | $2,425 | $54,125 |
| 2015 | $1,402 | $56,550 | $2,425 | $54,125 |
| 2014 | $1,402 | $56,541 | $0 | $0 |
Source: Public Records
Map
Nearby Homes
- 129 Norfolk Cir
- 135 Osborne Ln
- 154 Stonehenge St
- 257 Parliament Rd
- 185 River Rd
- Lot 18 Danielle Ct
- 157 Danielle Ct
- Lot 17 Danielle Ct
- Lot 29 Zachary Ct
- Lot 30 Robbins Ln
- 696 Forge Ridge Rd
- 000 Forge Ridge Rd
- 0 Madison Cir
- 262 Oxford Cir
- 262 Cresent St
- 187 Oxford Cir
- 0 Tower St
- 499 Cromwell St
- Lot 32 Cromwell St
- 327 Coleman St
- 283 Mockingbird Cir
- 324 Mockingbird Cir
- 379 Mockingbird Cir
- 387 Mockingbird Cir
- 254 Mockingbird Cir
- 402 Mockingbird Cir
- 427 Mockingbird Cir
- 430 Mockingbird Cir
- 233 Mockingbird Cir
- 231 Mockingbird Cir
- 0 Mockingbird Ln
- Lot #17 Mockingbird Cir
- Lot #16 Mockingbird Cir
- 0 Mockingbird Cir
- 170 Peters Dr
- 704 Pump Springs Rd
- 855 Pump Springs Rd
- 442 Mockingbird Cir
- 159 Mockingbird Cir
- 454 Mockingbird Cir