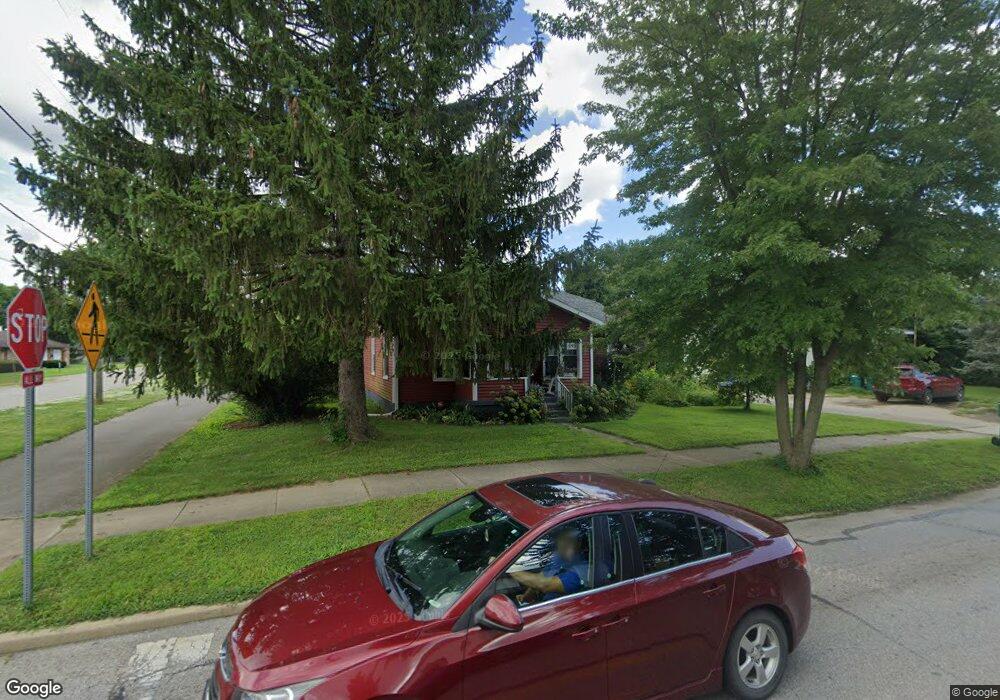
293 N Center St Plainfield, IN 46168
Estimated Value: $187,000 - $214,000
2
Beds
1
Bath
924
Sq Ft
$216/Sq Ft
Est. Value
About This Home
This home is located at 293 N Center St, Plainfield, IN 46168 and is currently estimated at $199,174, approximately $215 per square foot. 293 N Center St is a home located in Hendricks County with nearby schools including Central Elementary School, Plainfield Community Middle School, and Plainfield High School.
Ownership History
Date
Name
Owned For
Owner Type
Purchase Details
Closed on
Nov 3, 2017
Sold by
Lee Cary N
Bought by
Lee Trust
Current Estimated Value
Purchase Details
Closed on
Jul 24, 2017
Sold by
Fannie Mae
Bought by
Castano Cary
Purchase Details
Closed on
Jan 19, 2017
Sold by
Hendricks County Sheriff
Bought by
Federal National Mortgage Association
Purchase Details
Closed on
Feb 21, 2014
Sold by
Coe Bettie M
Bought by
Uribe Olivia
Purchase Details
Closed on
May 18, 2006
Sold by
Household Finance Corp Iii
Bought by
Duback Aaron
Home Financials for this Owner
Home Financials are based on the most recent Mortgage that was taken out on this home.
Original Mortgage
$66,000
Interest Rate
6.62%
Mortgage Type
New Conventional
Purchase Details
Closed on
Mar 16, 2006
Sold by
Edwards Chritopher M and Edwards Melissa
Bought by
Household Finance Corp Iii
Create a Home Valuation Report for This Property
The Home Valuation Report is an in-depth analysis detailing your home's value as well as a comparison with similar homes in the area
Home Values in the Area
Average Home Value in this Area
Purchase History
| Date | Buyer | Sale Price | Title Company |
|---|---|---|---|
| Lee Trust | -- | -- | |
| Castano Cary | $58,100 | Indy Legal Title | |
| Federal National Mortgage Association | $55,500 | -- | |
| Uribe Olivia | -- | -- | |
| Duback Aaron | -- | None Available | |
| Household Finance Corp Iii | $71,921 | None Available |
Source: Public Records
Mortgage History
| Date | Status | Borrower | Loan Amount |
|---|---|---|---|
| Previous Owner | Duback Aaron | $66,000 |
Source: Public Records
Tax History Compared to Growth
Tax History
| Year | Tax Paid | Tax Assessment Tax Assessment Total Assessment is a certain percentage of the fair market value that is determined by local assessors to be the total taxable value of land and additions on the property. | Land | Improvement |
|---|---|---|---|---|
| 2024 | $6,123 | $131,300 | $23,200 | $108,100 |
| 2023 | $856 | $124,900 | $22,000 | $102,900 |
| 2022 | $917 | $119,500 | $21,000 | $98,500 |
| 2021 | $823 | $110,400 | $21,000 | $89,400 |
| 2020 | $707 | $101,000 | $21,000 | $80,000 |
| 2019 | $785 | $108,000 | $20,600 | $87,400 |
| 2018 | $777 | $105,600 | $20,600 | $85,000 |
| 2017 | $470 | $84,600 | $19,800 | $64,800 |
| 2016 | $433 | $81,900 | $19,800 | $62,100 |
| 2014 | $425 | $80,400 | $19,800 | $60,600 |
Source: Public Records
Map
Nearby Homes
- 311 N Center St
- 325 N Center St
- 100 Lincoln St
- 225 N Center St
- 147 N Center St
- 2394 Eagle Ave
- 2198 Galleone Way
- 327 S Mill St
- 710 Hanna St
- 309 Duffey St
- 1042 W Main St
- 60 Pike Place
- 731 Andrews Blvd
- 550 548 S Center St
- 269 Andrews Boulevard East Dr
- 215 Andrews Boulevard East Dr
- 628 Gibbs Ct
- 251 Andrews Blvd
- 4181 Baranga Dr
- 980 Andico Rd
- 293 N Center St
- 293 N Center St Unit 10
- 283 N Center St
- 303 N Center St
- 290 N Vine St
- 286 N Vine St
- 277 N Center St
- 294 N Center St
- 284 N Center St
- 276 N Vine St
- 302 N Center St
- 312 N Vine St
- 276 N Center St
- 269 N Center St
- 312 N Center St
- 317 N Center St
- 264 N Vine St
- 283 N Vine St
- 270 N Center St
- 318 N Vine St