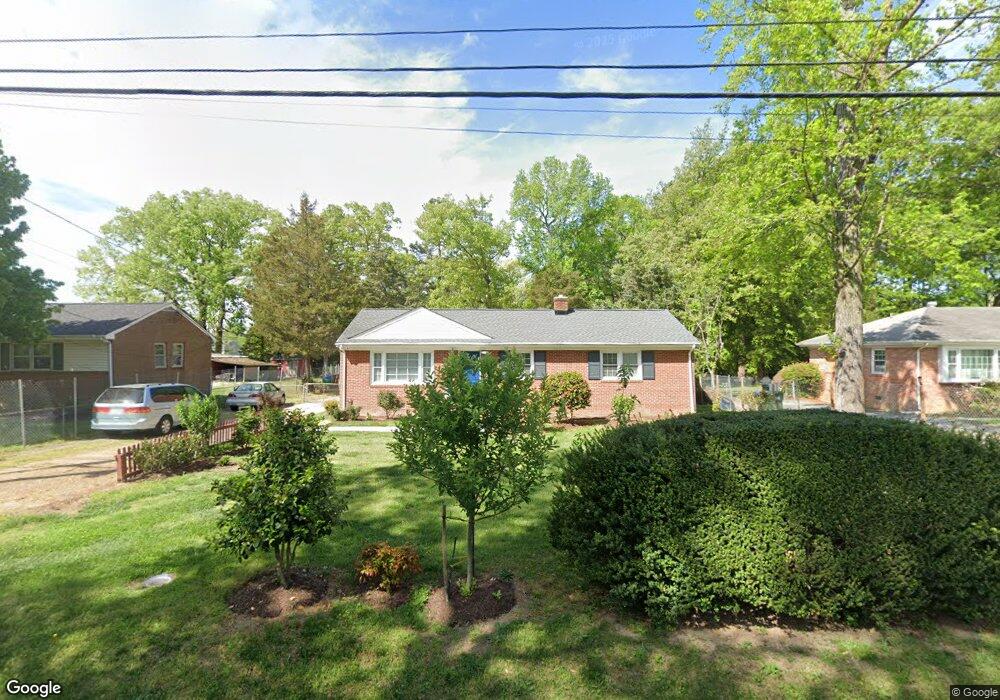
2930 Hey Rd Richmond, VA 23224
Fawnbrook NeighborhoodEstimated Value: $247,000 - $344,000
3
Beds
2
Baths
1,225
Sq Ft
$228/Sq Ft
Est. Value
About This Home
This home is located at 2930 Hey Rd, Richmond, VA 23224 and is currently estimated at $279,618, approximately $228 per square foot. 2930 Hey Rd is a home located in Richmond City with nearby schools including G.H. Reid Elementary School, Huguenot High School, and Open High School.
Ownership History
Date
Name
Owned For
Owner Type
Purchase Details
Closed on
Apr 8, 2003
Sold by
Royall Lois R
Bought by
Gutierrez Pablo E
Current Estimated Value
Home Financials for this Owner
Home Financials are based on the most recent Mortgage that was taken out on this home.
Original Mortgage
$71,800
Outstanding Balance
$31,139
Interest Rate
5.88%
Mortgage Type
New Conventional
Estimated Equity
$248,479
Create a Home Valuation Report for This Property
The Home Valuation Report is an in-depth analysis detailing your home's value as well as a comparison with similar homes in the area
Home Values in the Area
Average Home Value in this Area
Purchase History
| Date | Buyer | Sale Price | Title Company |
|---|---|---|---|
| Gutierrez Pablo E | $71,825 | -- |
Source: Public Records
Mortgage History
| Date | Status | Borrower | Loan Amount |
|---|---|---|---|
| Open | Gutierrez Pablo E | $71,800 |
Source: Public Records
Tax History Compared to Growth
Tax History
| Year | Tax Paid | Tax Assessment Tax Assessment Total Assessment is a certain percentage of the fair market value that is determined by local assessors to be the total taxable value of land and additions on the property. | Land | Improvement |
|---|---|---|---|---|
| 2025 | $2,628 | $219,000 | $53,000 | $166,000 |
| 2024 | $2,412 | $201,000 | $48,000 | $153,000 |
| 2023 | $2,268 | $189,000 | $48,000 | $141,000 |
| 2022 | $1,956 | $163,000 | $38,000 | $125,000 |
| 2021 | $1,632 | $137,000 | $33,000 | $104,000 |
| 2020 | $1,632 | $136,000 | $33,000 | $103,000 |
| 2019 | $1,536 | $128,000 | $35,000 | $93,000 |
| 2018 | $1,476 | $123,000 | $35,000 | $88,000 |
| 2017 | $1,404 | $117,000 | $35,000 | $82,000 |
| 2016 | $1,284 | $107,000 | $35,000 | $72,000 |
| 2015 | $1,284 | $107,000 | $35,000 | $72,000 |
| 2014 | $1,284 | $107,000 | $35,000 | $72,000 |
Source: Public Records
Map
Nearby Homes
- 3109 Johns Way
- 3108 Johns Way
- 3112 Johns Way
- 3116 Amanda Dr
- 2549 Clearfield St
- 3609 Burgain Ct
- 3104 S Battlebridge Dr
- 6026 Partingdale Cir
- 2401 Clearfield St
- 5221 Snead Rd
- 6450 Holborn Rd
- 5331 White Oak Dr
- 4913 Belmont Rd
- 3401 Marwick Place
- 6331 Elkhardt Ln
- 5180 Bemiss Rd
- 2710 Pauls Ln
- 3014 Kim Dr
- 2431 Brinkwood Dr
- 5511 Belle Pond Dr