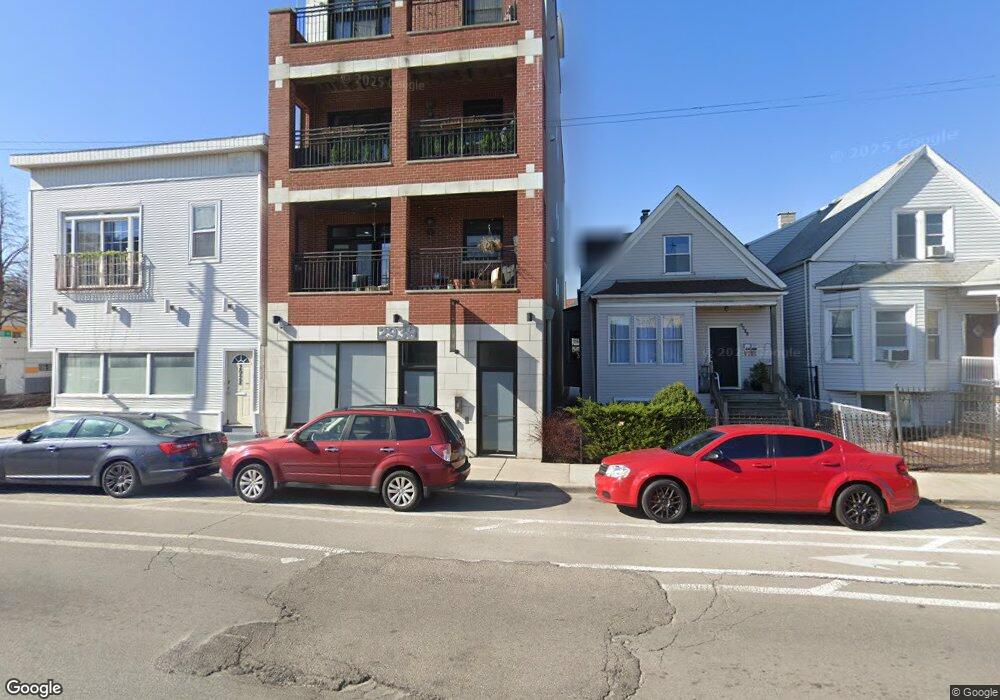
2930 N Elston Ave Unit 1 Chicago, IL 60618
Avondale NeighborhoodEstimated Value: $149,886
--
Bed
9
Baths
1,248
Sq Ft
$120/Sq Ft
Est. Value
About This Home
This home is located at 2930 N Elston Ave Unit 1, Chicago, IL 60618 and is currently estimated at $149,886, approximately $120 per square foot. 2930 N Elston Ave Unit 1 is a home located in Cook County with nearby schools including Brentano Math & Science Academy, Schurz High School, and Acero Charter - Carlos Fuentes Cmpus.
Ownership History
Date
Name
Owned For
Owner Type
Purchase Details
Closed on
Jul 18, 2017
Sold by
Fernandes Jacques and Rippberger Cassie
Bought by
Rmz Properties Llc
Current Estimated Value
Purchase Details
Closed on
Nov 21, 2014
Sold by
Wendorf Lori S
Bought by
Fernandes Jacques and Rippberger Cassie
Purchase Details
Closed on
Mar 27, 2009
Sold by
Slab Ventures Llc
Bought by
Wendorf Lori S
Purchase Details
Closed on
Mar 24, 2009
Sold by
Wendoff Lori S
Bought by
Slab Ventures Llc
Purchase Details
Closed on
Jul 23, 2007
Sold by
Barjaktarevic Lydia and Barjaktarevic Nebojsa
Bought by
Slab Ventures Llc
Purchase Details
Closed on
Dec 9, 1993
Sold by
Barjaktarevic Vucko and Barjaktarevic Lydia
Bought by
Barjaktarevic Lydia and Barjaktarevic Nebojsa
Create a Home Valuation Report for This Property
The Home Valuation Report is an in-depth analysis detailing your home's value as well as a comparison with similar homes in the area
Home Values in the Area
Average Home Value in this Area
Purchase History
| Date | Buyer | Sale Price | Title Company |
|---|---|---|---|
| Rmz Properties Llc | $115,000 | First American Title Insuran | |
| Fernandes Jacques | $85,000 | None Available | |
| Wendorf Lori S | -- | Chicago Title Insurance Co | |
| Wendorf Lori S | -- | Cti | |
| Slab Ventures Llc | -- | None Available | |
| Slab Ventures Llc | $335,000 | Ctic | |
| Barjaktarevic Lydia | -- | -- |
Source: Public Records
Tax History Compared to Growth
Tax History
| Year | Tax Paid | Tax Assessment Tax Assessment Total Assessment is a certain percentage of the fair market value that is determined by local assessors to be the total taxable value of land and additions on the property. | Land | Improvement |
|---|---|---|---|---|
| 2024 | $7,928 | $40,500 | $2,381 | $38,119 |
| 2023 | $7,727 | $37,440 | $2,381 | $35,059 |
| 2022 | $7,727 | $37,440 | $2,381 | $35,059 |
| 2021 | $7,554 | $37,440 | $2,381 | $35,059 |
| 2020 | $6,428 | $28,750 | $2,381 | $26,369 |
| 2019 | $5,797 | $28,750 | $2,381 | $26,369 |
| 2018 | $5,679 | $28,750 | $2,381 | $26,369 |
| 2017 | $9,403 | $43,681 | $2,381 | $41,300 |
| 2016 | $4,256 | $21,250 | $2,381 | $18,869 |
| 2015 | $8,004 | $43,681 | $2,381 | $41,300 |
| 2014 | $978 | $5,270 | $2,381 | $2,889 |
| 2013 | $5,688 | $31,273 | $2,381 | $28,892 |
Source: Public Records
Map
Nearby Homes
- 2954 N Elston Ave
- 2826 N Rockwell St
- 2924 N Talman Ave Unit 3
- 2820 N Rockwell St Unit 2
- 2622 W Wellington Ave
- 2602 W Diversey Ave Unit 302
- 2612 W Diversey Ave Unit 101
- 2828 N Talman Ave Unit D
- 2644 W Wellington Ave
- 2444 W Diversey Ave Unit 1W
- 2723 W Wellington Ave Unit 1
- 2733 N Maplewood Ave
- 2728 N Campbell Ave
- 2733 W Nelson St
- 2727 N Artesian Ave
- 2712 N Artesian Ave Unit 3
- 2710 N Artesian Ave
- 2864 N Riverwalk Dr
- 2337 W Wolfram St Unit 415
- 2337 W Wolfram St Unit 411
- 2930 N Elston Ave Unit 3
- 2930 N Elston Ave Unit 2
- 2930 N Elston Ave Unit OFFICE
- 2930 N Elston Ave
- 2930 N Elston Ave Unit 1
- 2930 N Elston Ave Unit 2
- 2930 N Elston Ave Unit 3
- 2928 N Elston Ave
- 2928 N Elston Ave
- 2934 N Elston Ave
- 2932 N Elston Ave Unit 1
- 2938 N Elston Ave
- 2940 N Elston Ave Unit 2
- 2920 N Elston Ave
- 2538 W George St
- 2942 N Elston Ave
- 2942 N Elston Ave Unit 1
- 2942 N Elston Ave Unit 3
- 2942 N Elston Ave
- 2540 W George St