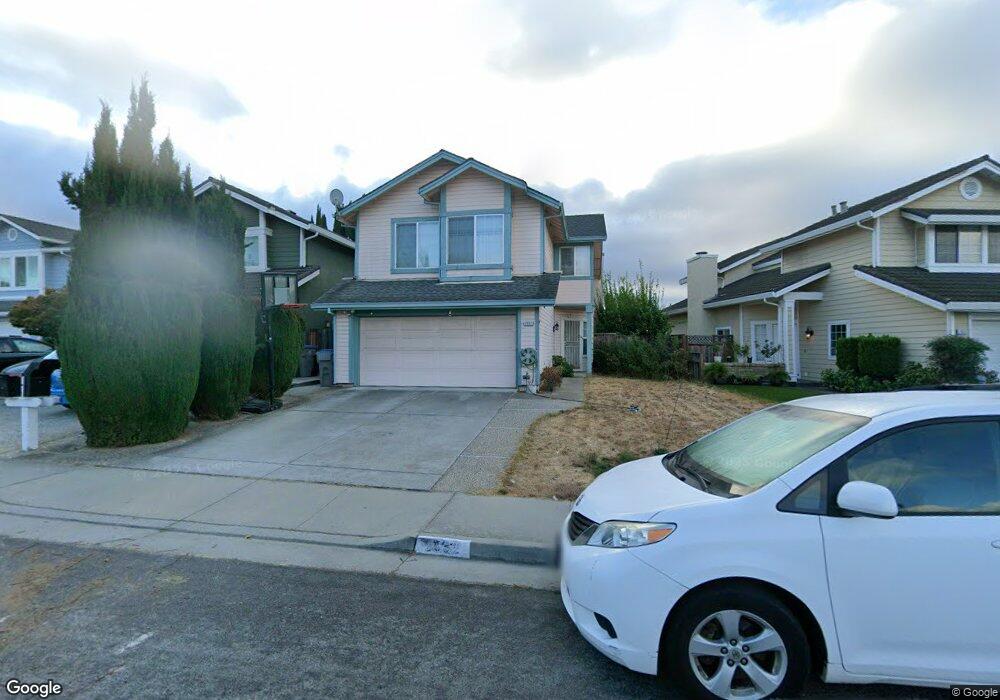
2932 Creek Point Dr San Jose, CA 95133
Penitencia NeighborhoodEstimated Value: $1,695,000 - $1,784,000
4
Beds
3
Baths
1,904
Sq Ft
$915/Sq Ft
Est. Value
About This Home
This home is located at 2932 Creek Point Dr, San Jose, CA 95133 and is currently estimated at $1,741,717, approximately $914 per square foot. 2932 Creek Point Dr is a home located in Santa Clara County with nearby schools including Toyon Elementary School, Piedmont Middle School, and Independence High School.
Ownership History
Date
Name
Owned For
Owner Type
Purchase Details
Closed on
Apr 16, 2021
Sold by
Guo Paul Yunjia and Wang Ying
Bought by
Guo And Wang Family Trust and Guo
Current Estimated Value
Purchase Details
Closed on
Mar 21, 2021
Sold by
Guo Paul Y and Wang Ying
Bought by
Guo Paul Y and Wang Ying
Purchase Details
Closed on
Mar 6, 2012
Sold by
Wang Ying and Guo Paul Yunjia
Bought by
Wang Ying and Guo Paul Yunjia
Home Financials for this Owner
Home Financials are based on the most recent Mortgage that was taken out on this home.
Original Mortgage
$190,000
Interest Rate
3.92%
Mortgage Type
New Conventional
Purchase Details
Closed on
Sep 17, 2003
Sold by
Fu Yung Nien and Chen Joyce
Bought by
Guo Paul Yunjia and Wang Ying
Home Financials for this Owner
Home Financials are based on the most recent Mortgage that was taken out on this home.
Original Mortgage
$448,000
Interest Rate
5.12%
Mortgage Type
Purchase Money Mortgage
Purchase Details
Closed on
Nov 2, 2001
Sold by
Fu Yung Nien
Bought by
Fu Yung Nien and Chen Joyce
Home Financials for this Owner
Home Financials are based on the most recent Mortgage that was taken out on this home.
Original Mortgage
$200,000
Interest Rate
6.73%
Purchase Details
Closed on
Oct 29, 1998
Sold by
Fu Yung Nien
Bought by
Fu Yung Nien
Home Financials for this Owner
Home Financials are based on the most recent Mortgage that was taken out on this home.
Original Mortgage
$150,000
Interest Rate
6.61%
Purchase Details
Closed on
May 28, 1998
Sold by
Chen Joyce W
Bought by
Fu Yung Nien
Home Financials for this Owner
Home Financials are based on the most recent Mortgage that was taken out on this home.
Original Mortgage
$150,000
Interest Rate
7.1%
Purchase Details
Closed on
Feb 11, 1997
Sold by
Nan I Chien
Bought by
Fu Yung Nien
Home Financials for this Owner
Home Financials are based on the most recent Mortgage that was taken out on this home.
Original Mortgage
$110,000
Interest Rate
7.86%
Purchase Details
Closed on
Mar 4, 1996
Sold by
Chien Nan I and Wu Li Er
Bought by
Chien Nan I and Wu Li Er
Home Financials for this Owner
Home Financials are based on the most recent Mortgage that was taken out on this home.
Original Mortgage
$167,900
Interest Rate
7%
Mortgage Type
Balloon
Purchase Details
Closed on
Jul 12, 1994
Sold by
Chandra Raju and Chandra Seema
Bought by
Chien Nan I and Wu Li Er
Home Financials for this Owner
Home Financials are based on the most recent Mortgage that was taken out on this home.
Original Mortgage
$170,000
Interest Rate
8.25%
Create a Home Valuation Report for This Property
The Home Valuation Report is an in-depth analysis detailing your home's value as well as a comparison with similar homes in the area
Home Values in the Area
Average Home Value in this Area
Purchase History
| Date | Buyer | Sale Price | Title Company |
|---|---|---|---|
| Guo And Wang Family Trust | -- | None Listed On Document | |
| Guo Paul Y | -- | None Available | |
| Wang Ying | -- | Fidelity National Title Co | |
| Guo Paul Yunjia | $560,000 | Chicago Title | |
| Fu Yung Nien | -- | Chicago Title Co | |
| Fu Yung Nien | -- | Stewart Title | |
| Fu Yung Nien | -- | Stewart Title | |
| Fu Yung Nien | $305,000 | Chicago Title Co | |
| Chien Nan I | -- | Fidelity National Title Ins | |
| Chien Nan I | $276,500 | Old Republic Title Company |
Source: Public Records
Mortgage History
| Date | Status | Borrower | Loan Amount |
|---|---|---|---|
| Previous Owner | Wang Ying | $190,000 | |
| Previous Owner | Guo Paul Yunjia | $448,000 | |
| Previous Owner | Fu Yung Nien | $200,000 | |
| Previous Owner | Fu Yung Nien | $150,000 | |
| Previous Owner | Fu Yung Nien | $150,000 | |
| Previous Owner | Fu Yung Nien | $110,000 | |
| Previous Owner | Chien Nan I | $167,900 | |
| Previous Owner | Chien Nan I | $170,000 |
Source: Public Records
Tax History Compared to Growth
Tax History
| Year | Tax Paid | Tax Assessment Tax Assessment Total Assessment is a certain percentage of the fair market value that is determined by local assessors to be the total taxable value of land and additions on the property. | Land | Improvement |
|---|---|---|---|---|
| 2025 | $11,288 | $795,832 | $318,331 | $477,501 |
| 2024 | $11,288 | $780,229 | $312,090 | $468,139 |
| 2023 | $11,087 | $764,931 | $305,971 | $458,960 |
| 2022 | $11,042 | $749,933 | $299,972 | $449,961 |
| 2021 | $10,688 | $735,230 | $294,091 | $441,139 |
| 2020 | $10,361 | $727,692 | $291,076 | $436,616 |
| 2019 | $9,967 | $713,424 | $285,369 | $428,055 |
| 2018 | $9,826 | $699,436 | $279,774 | $419,662 |
| 2017 | $9,886 | $685,723 | $274,289 | $411,434 |
| 2016 | $9,475 | $672,278 | $268,911 | $403,367 |
| 2015 | $9,365 | $662,181 | $264,872 | $397,309 |
| 2014 | $8,631 | $649,211 | $259,684 | $389,527 |
Source: Public Records
Map
Nearby Homes
- 2806 Glauser Dr
- 3092 Halgrim Ct
- 1068 Ondine Ct
- 693 Kirk Glen Dr
- 3308 Whitman Way
- 1103 Somerset Dr
- 673 Kirk Glen Dr
- 2714 Mabury Square
- 2616 Sierra Village Ct
- 1199 Morrill Ave
- 982 Harcot Ct
- 994 Harcot Ct
- 998 Harcot Ct
- 981 Harcot Ct
- 997 Harcot Ct
- 1055 N Capitol Ave Unit 124
- 1055 N Capitol Ave Unit 180
- 1055 N Capitol Ave Unit 51
- 1204 Somerset Dr
- Residence 2 Plan at Ascend
- 2934 Creek Point Dr
- 2926 Creek Point Dr
- 2936 Creek Point Dr
- 2920 Creek Point Dr
- 894 Kiperash Ct
- 897 Kiperash Ct
- 2916 Creek Point Dr
- 2950 Creek Point Dr
- 2952 Creek Point Dr
- 2954 Creek Point Dr
- 890 Kiperash Ct
- 893 Kiperash Ct
- 2931 Creek Point Dr
- 2956 Creek Point Dr
- 2933 Creek Point Dr
- 2935 Creek Point Dr
- 2919 Creek Point Dr
- 2927 Creek Point Dr
- 2912 Creek Point Dr
- 2917 Creek Point Dr