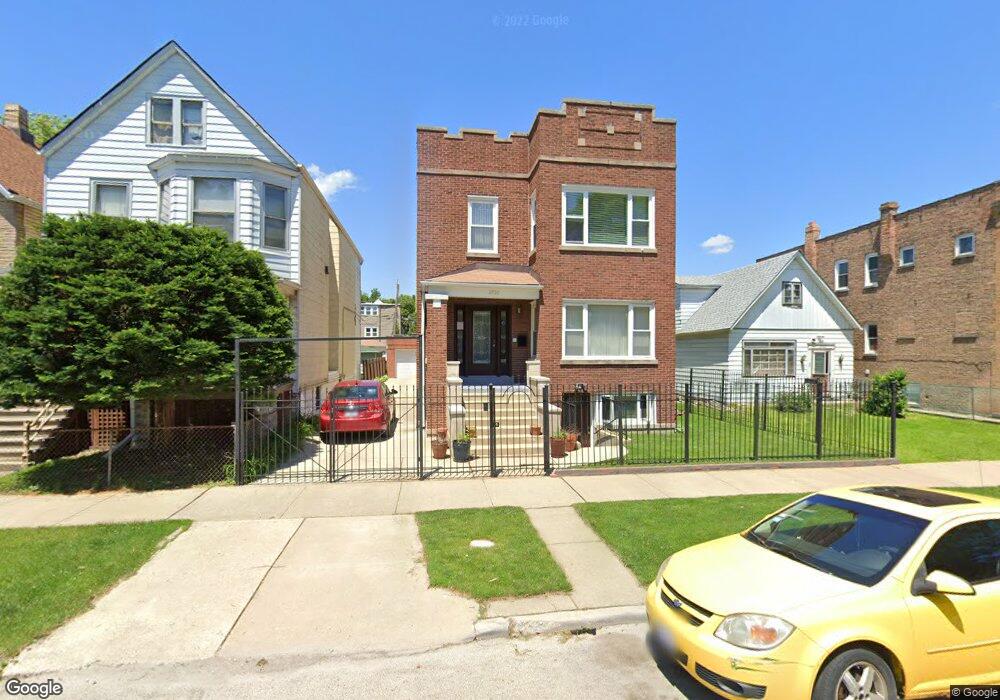
2936 N Gresham Ave Unit 3 Chicago, IL 60618
Avondale NeighborhoodEstimated Value: $291,000 - $350,000
2
Beds
3
Baths
1,000
Sq Ft
$319/Sq Ft
Est. Value
About This Home
This home is located at 2936 N Gresham Ave Unit 3, Chicago, IL 60618 and is currently estimated at $318,924, approximately $318 per square foot. 2936 N Gresham Ave Unit 3 is a home located in Cook County with nearby schools including Reilly Elementary School, Schurz High School, and Aspira Business & Finance High School.
Ownership History
Date
Name
Owned For
Owner Type
Purchase Details
Closed on
Nov 5, 2018
Sold by
Soghigian Avedis A
Bought by
Cirincione Christopher
Current Estimated Value
Home Financials for this Owner
Home Financials are based on the most recent Mortgage that was taken out on this home.
Original Mortgage
$221,000
Outstanding Balance
$192,432
Interest Rate
4.62%
Mortgage Type
New Conventional
Estimated Equity
$126,492
Purchase Details
Closed on
Feb 28, 2002
Sold by
Lasalle Bank National Assn
Bought by
Soghigian Avedis
Home Financials for this Owner
Home Financials are based on the most recent Mortgage that was taken out on this home.
Original Mortgage
$182,400
Interest Rate
7.07%
Create a Home Valuation Report for This Property
The Home Valuation Report is an in-depth analysis detailing your home's value as well as a comparison with similar homes in the area
Home Values in the Area
Average Home Value in this Area
Purchase History
| Date | Buyer | Sale Price | Title Company |
|---|---|---|---|
| Cirincione Christopher | $260,000 | Jp Title | |
| Soghigian Avedis | $192,500 | -- |
Source: Public Records
Mortgage History
| Date | Status | Borrower | Loan Amount |
|---|---|---|---|
| Open | Cirincione Christopher | $221,000 | |
| Previous Owner | Soghigian Avedis | $182,400 |
Source: Public Records
Tax History
| Year | Tax Paid | Tax Assessment Tax Assessment Total Assessment is a certain percentage of the fair market value that is determined by local assessors to be the total taxable value of land and additions on the property. | Land | Improvement |
|---|---|---|---|---|
| 2025 | $4,822 | $29,800 | $8,192 | $21,608 |
| 2024 | $4,822 | $29,800 | $8,192 | $21,608 |
| 2023 | $4,678 | $26,075 | $6,591 | $19,484 |
| 2022 | $4,678 | $26,075 | $6,591 | $19,484 |
| 2021 | $4,591 | $26,074 | $6,591 | $19,483 |
| 2020 | $4,354 | $22,566 | $3,013 | $19,553 |
| 2019 | $4,403 | $25,253 | $3,013 | $22,240 |
| 2018 | $4,312 | $25,253 | $3,013 | $22,240 |
| 2017 | $3,632 | $20,239 | $2,636 | $17,603 |
| 2016 | $3,555 | $20,239 | $2,636 | $17,603 |
| 2015 | $3,230 | $20,239 | $2,636 | $17,603 |
| 2014 | $2,561 | $16,359 | $2,259 | $14,100 |
| 2013 | $2,499 | $16,359 | $2,259 | $14,100 |
Source: Public Records
Map
Nearby Homes
- 2955 N Gresham Ave
- 3027 N Elbridge Ave
- 3037 N Central Park Ave
- 3011 N Kimball Ave
- 3518 W Wolfram St Unit 2
- 2862 N Woodard St
- 3051 N Christiana Ave
- 3055 N Christiana Ave
- 3057 N Christiana Ave
- 2915 N Spaulding Ave
- 3611 W Diversey Ave
- 2737 N Central Park Ave
- 3101 N Ridgeway Ave Unit 4D
- 3120 N Spaulding Ave
- 3222 N Drake Ave
- 3137 N Spaulding Ave
- 2837 N Sawyer Ave Unit 3R
- 3036 N Kedzie Ave
- 3742 W Diversey Ave
- 2921 N Kedzie Ave
- 2936 N Gresham Ave Unit G
- 2936 N Gresham Ave Unit 3
- 2936 N Gresham Ave Unit 2
- 2936 N Gresham Ave Unit 1
- 2934 N Gresham Ave Unit 1
- 2944 N Gresham Ave
- 2944 N Gresham Ave
- 2932 N Gresham Ave Unit 2
- 2932 N Gresham Ave
- 2930 N Gresham Ave
- 2930 N Gresham Ave
- 2946 N Gresham Ave
- 2946 N Gresham Ave
- 2926 N Gresham Ave
- 2950 N Gresham Ave Unit 1
- 2941 N Gresham Ave
- 2924 N Gresham Ave
- 2937 N Gresham Ave Unit 1
- 2937 N Gresham Ave
- 2937 N Gresham Ave Unit 2
Your Personal Tour Guide
Ask me questions while you tour the home.