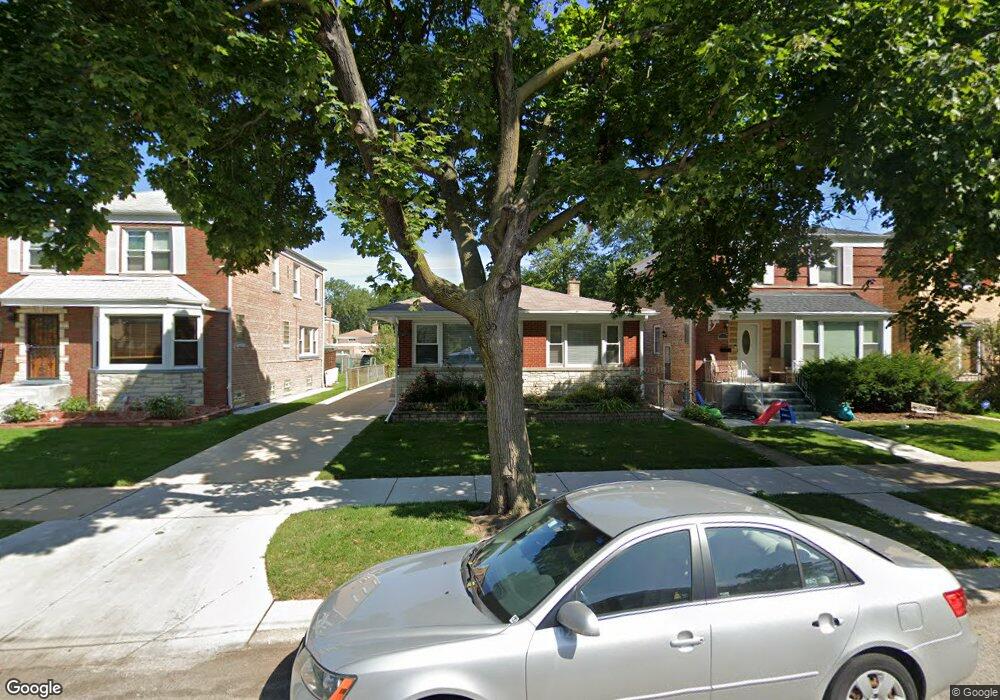
2936 W Fargo Ave Chicago, IL 60645
West Ridge NeighborhoodEstimated Value: $503,000 - $646,000
4
Beds
3
Baths
1,738
Sq Ft
$340/Sq Ft
Est. Value
About This Home
This home is located at 2936 W Fargo Ave, Chicago, IL 60645 and is currently estimated at $591,136, approximately $340 per square foot. 2936 W Fargo Ave is a home located in Cook County with nearby schools including Rogers Elementary School, Mather High School, and St Margaret Mary Elementary School.
Ownership History
Date
Name
Owned For
Owner Type
Purchase Details
Closed on
Oct 8, 2020
Sold by
Delgado Juan F and Delgado Victoria L
Bought by
Delgado Juan F and Delgado Victoria L
Current Estimated Value
Purchase Details
Closed on
May 28, 1999
Sold by
Rengert Veronica
Bought by
Delgado Juan F and Delgado Victoria L
Home Financials for this Owner
Home Financials are based on the most recent Mortgage that was taken out on this home.
Original Mortgage
$189,000
Outstanding Balance
$49,599
Interest Rate
6.99%
Estimated Equity
$541,537
Purchase Details
Closed on
Mar 15, 1999
Sold by
Fang Jessie
Bought by
Rengert Veronica
Purchase Details
Closed on
Aug 22, 1997
Sold by
Rengert Mary and Rengert Veronica
Bought by
Fang Jessie
Purchase Details
Closed on
Dec 22, 1995
Sold by
Cruel Hugo and Cruel Olivia
Bought by
Fang Jessie J and Rengert Mary
Home Financials for this Owner
Home Financials are based on the most recent Mortgage that was taken out on this home.
Original Mortgage
$145,600
Interest Rate
7.28%
Create a Home Valuation Report for This Property
The Home Valuation Report is an in-depth analysis detailing your home's value as well as a comparison with similar homes in the area
Home Values in the Area
Average Home Value in this Area
Purchase History
| Date | Buyer | Sale Price | Title Company |
|---|---|---|---|
| Delgado Juan F | -- | None Available | |
| Delgado Juan F | $210,000 | -- | |
| Rengert Veronica | -- | -- | |
| Fang Jessie | -- | Law Title Insurance Co | |
| Fang Jessie J | $208,000 | -- |
Source: Public Records
Mortgage History
| Date | Status | Borrower | Loan Amount |
|---|---|---|---|
| Open | Delgado Juan F | $189,000 | |
| Previous Owner | Fang Jessie J | $145,600 |
Source: Public Records
Tax History Compared to Growth
Tax History
| Year | Tax Paid | Tax Assessment Tax Assessment Total Assessment is a certain percentage of the fair market value that is determined by local assessors to be the total taxable value of land and additions on the property. | Land | Improvement |
|---|---|---|---|---|
| 2024 | $7,740 | $40,489 | $13,950 | $26,539 |
| 2023 | $7,524 | $40,000 | $11,160 | $28,840 |
| 2022 | $7,524 | $40,000 | $11,160 | $28,840 |
| 2021 | $7,374 | $40,000 | $11,160 | $28,840 |
| 2020 | $5,963 | $29,872 | $8,091 | $21,781 |
| 2019 | $5,972 | $33,154 | $8,091 | $25,063 |
| 2018 | $5,870 | $33,154 | $8,091 | $25,063 |
| 2017 | $5,755 | $30,109 | $7,254 | $22,855 |
| 2016 | $6,125 | $33,079 | $7,254 | $25,825 |
| 2015 | $5,581 | $33,079 | $7,254 | $25,825 |
| 2014 | $4,837 | $28,636 | $6,696 | $21,940 |
| 2013 | $4,730 | $28,636 | $6,696 | $21,940 |
Source: Public Records
Map
Nearby Homes
- 3024 W Fargo Ave
- 3123 W Chase Ave
- 2011 Brummel St
- 7433 N Washtenaw Ave
- 220 Richmond St
- 235 Richmond St
- 1615 W Howard St Unit 303
- 2650 W Touhy Ave
- 7141 N Kedzie Ave Unit 406
- 7141 N Kedzie Ave Unit 1515
- 7141 N Kedzie Ave Unit 1209
- 7141 N Kedzie Ave Unit 403
- 2522 W Jarvis Ave
- 7061 N Kedzie Ave Unit 706
- 309 Darrow Ave
- 7033 N Kedzie Ave Unit 401
- 7033 N Kedzie Ave Unit 606
- 7033 N Kedzie Ave Unit 301
- 7033 N Kedzie Ave Unit 1704
- 7249 N Campbell Ave Unit B
- 2934 W Fargo Ave
- 2942 W Fargo Ave
- 2930 W Fargo Ave
- 2946 W Fargo Ave
- 2928 W Fargo Ave
- 2948 W Fargo Ave
- 2924 W Fargo Ave
- 2937 W Birchwood Ave
- 2952 W Fargo Ave
- 2943 W Birchwood Ave
- 2933 W Birchwood Ave
- 2922 W Fargo Ave
- 2947 W Birchwood Ave
- 2956 W Fargo Ave
- 2929 W Birchwood Ave
- 2949 W Birchwood Ave
- 2918 W Fargo Ave
- 2939 W Fargo Ave
- 2935 W Fargo Ave
- 2941 W Fargo Ave