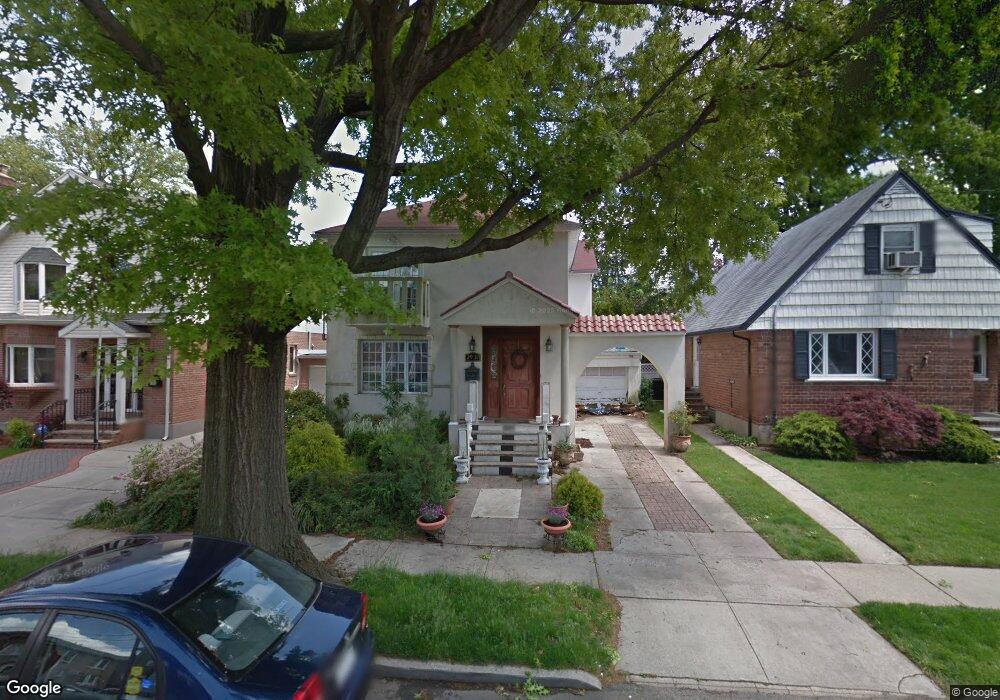
2937 164th St Flushing, NY 11358
Flushing NeighborhoodEstimated Value: $1,118,290 - $1,277,000
--
Bed
--
Bath
1,586
Sq Ft
$737/Sq Ft
Est. Value
About This Home
This home is located at 2937 164th St, Flushing, NY 11358 and is currently estimated at $1,168,823, approximately $736 per square foot. 2937 164th St is a home located in Queens County with nearby schools including P.S. 32 - State Street, I.S. 25 Adrien Block, and Francis Lewis High School.
Ownership History
Date
Name
Owned For
Owner Type
Purchase Details
Closed on
Oct 14, 2005
Sold by
Avlonitis Dinos
Bought by
Avlonitis Dinos and Avlonitis Mania
Current Estimated Value
Purchase Details
Closed on
Jan 4, 1996
Sold by
Somol Hildur I
Bought by
Avlonitis Dinos
Home Financials for this Owner
Home Financials are based on the most recent Mortgage that was taken out on this home.
Original Mortgage
$169,600
Outstanding Balance
$2,293
Interest Rate
7.25%
Estimated Equity
$1,166,530
Create a Home Valuation Report for This Property
The Home Valuation Report is an in-depth analysis detailing your home's value as well as a comparison with similar homes in the area
Home Values in the Area
Average Home Value in this Area
Purchase History
| Date | Buyer | Sale Price | Title Company |
|---|---|---|---|
| Avlonitis Dinos | -- | -- | |
| Avlonitis Dinos | -- | -- | |
| Avlonitis Dinos | $212,000 | -- | |
| Avlonitis Dinos | $212,000 | -- |
Source: Public Records
Mortgage History
| Date | Status | Borrower | Loan Amount |
|---|---|---|---|
| Open | Avlonitis Dinos | $169,600 | |
| Closed | Avlonitis Dinos | $169,600 |
Source: Public Records
Tax History Compared to Growth
Tax History
| Year | Tax Paid | Tax Assessment Tax Assessment Total Assessment is a certain percentage of the fair market value that is determined by local assessors to be the total taxable value of land and additions on the property. | Land | Improvement |
|---|---|---|---|---|
| 2025 | $10,781 | $56,464 | $18,647 | $37,817 |
| 2024 | $10,781 | $53,677 | $18,605 | $35,072 |
| 2023 | $10,442 | $51,988 | $17,217 | $34,771 |
| 2022 | $9,873 | $57,780 | $21,420 | $36,360 |
| 2021 | $10,408 | $53,580 | $21,420 | $32,160 |
| 2020 | $9,960 | $58,920 | $21,420 | $37,500 |
| 2019 | $9,357 | $56,640 | $21,420 | $35,220 |
| 2018 | $8,831 | $43,323 | $16,577 | $26,746 |
| 2017 | $8,402 | $41,215 | $17,209 | $24,006 |
| 2016 | $8,239 | $41,215 | $17,209 | $24,006 |
| 2015 | $4,690 | $39,211 | $19,556 | $19,655 |
| 2014 | $4,690 | $37,276 | $22,321 | $14,955 |
Source: Public Records
Map
Nearby Homes