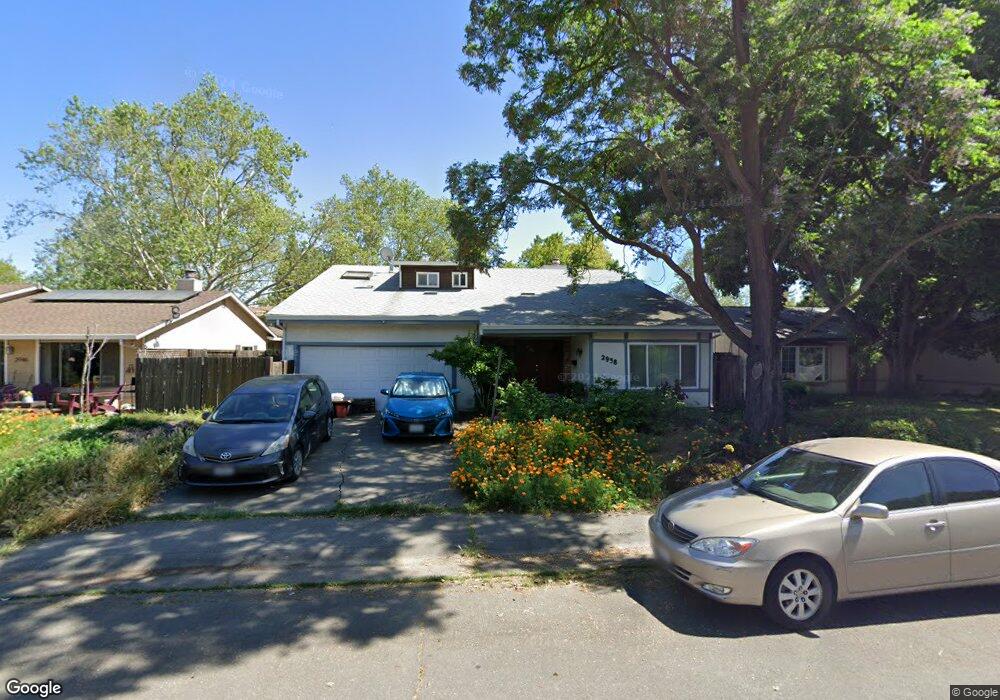
2938 Concord Ave Davis, CA 95618
South Davis NeighborhoodEstimated Value: $775,000 - $802,000
4
Beds
3
Baths
1,900
Sq Ft
$415/Sq Ft
Est. Value
About This Home
This home is located at 2938 Concord Ave, Davis, CA 95618 and is currently estimated at $789,015, approximately $415 per square foot. 2938 Concord Ave is a home located in Yolo County with nearby schools including Marguerite Montgomery Elementary School, Frances Ellen Watkins Harper Junior High School, and Davis Senior High School.
Ownership History
Date
Name
Owned For
Owner Type
Purchase Details
Closed on
Nov 6, 2020
Sold by
Chatfield Geoffrey W and Ly Hoa C
Bought by
Chatfield Geoffrey W and Ly Hoa C
Current Estimated Value
Purchase Details
Closed on
Jun 23, 2015
Sold by
Phan Trang Anh T and Phan Anh
Bought by
Chatfield Geoffrey W and Ly Hoa C
Home Financials for this Owner
Home Financials are based on the most recent Mortgage that was taken out on this home.
Original Mortgage
$404,000
Outstanding Balance
$313,577
Interest Rate
3.81%
Mortgage Type
New Conventional
Estimated Equity
$475,438
Purchase Details
Closed on
Oct 18, 2013
Sold by
Duong Binh Q
Bought by
Phan Trang Anh T
Purchase Details
Closed on
Oct 14, 1998
Sold by
Marie Mcnaughton Arthur F and Marie Lisa
Bought by
Duong Binh and Phan Anh
Home Financials for this Owner
Home Financials are based on the most recent Mortgage that was taken out on this home.
Original Mortgage
$109,800
Interest Rate
6.71%
Create a Home Valuation Report for This Property
The Home Valuation Report is an in-depth analysis detailing your home's value as well as a comparison with similar homes in the area
Home Values in the Area
Average Home Value in this Area
Purchase History
| Date | Buyer | Sale Price | Title Company |
|---|---|---|---|
| Chatfield Geoffrey W | -- | None Available | |
| Chatfield Geoffrey W | $505,000 | Placer Title Company | |
| Phan Trang Anh T | -- | None Available | |
| Duong Binh | $183,000 | First American Title Co |
Source: Public Records
Mortgage History
| Date | Status | Borrower | Loan Amount |
|---|---|---|---|
| Open | Chatfield Geoffrey W | $404,000 | |
| Previous Owner | Duong Binh | $109,800 |
Source: Public Records
Tax History
| Year | Tax Paid | Tax Assessment Tax Assessment Total Assessment is a certain percentage of the fair market value that is determined by local assessors to be the total taxable value of land and additions on the property. | Land | Improvement |
|---|---|---|---|---|
| 2025 | $7,981 | $620,182 | $180,271 | $439,911 |
| 2023 | $7,981 | $583,357 | $173,272 | $410,085 |
| 2022 | $7,650 | $571,920 | $169,875 | $402,045 |
| 2021 | $7,397 | $560,707 | $166,545 | $394,162 |
| 2020 | $7,279 | $554,959 | $164,838 | $390,121 |
| 2019 | $6,956 | $544,078 | $161,606 | $382,472 |
| 2018 | $6,475 | $533,411 | $158,438 | $374,973 |
| 2017 | $6,340 | $522,953 | $155,332 | $367,621 |
| 2016 | $6,150 | $512,700 | $152,287 | $360,413 |
| 2015 | $3,315 | $238,696 | $78,258 | $160,438 |
| 2014 | $3,315 | $234,022 | $76,726 | $157,296 |
Source: Public Records
Map
Nearby Homes
- 3180 Albany Cir
- 1175 Greene Terrace
- 1107 Greene Terrace Unit 5101
- 1174 Greene Terrace
- 3423 Monte Vista Ave
- 43120 Montgomery Ave
- 3723 Modoc Place
- 103 Full Cir
- 217 La Vida Way
- 218 Full Cir
- 257 Quarter Cir
- 119 Hedy Ln
- 4007 Nandina Place
- 4108 Tallow Place
- 124 Hedy Ln
- 1049 Ginkgo Cir
- 1013 Ginkgo Cir
- 1007 Ginkgo Cir
- 1001 Ginkgo Cir
- 1013 Vanderbilt Terrace
- 2946 Concord Ave
- 2932 Concord Ave
- 2925 Lillard Dr Unit 27
- 2927 Lillard Dr
- 2952 Concord Ave
- 2931 Lillard Dr Unit 33
- 2926 Concord Ave
- 915 Bliss Ct
- 2919 Lillard Dr Unit 21
- 2958 Concord Ave
- 1020 Clark Ct
- 2937 Lillard Dr
- 2920 Concord Ave
- 2913 Lillard Dr
- 909 Bliss Ct
- 1014 Clark Ct
- 2914 Concord Ave
- 2905 Lillard Dr
- 1008 Clark Ct
- 1029 Clark Ct
Your Personal Tour Guide
Ask me questions while you tour the home.