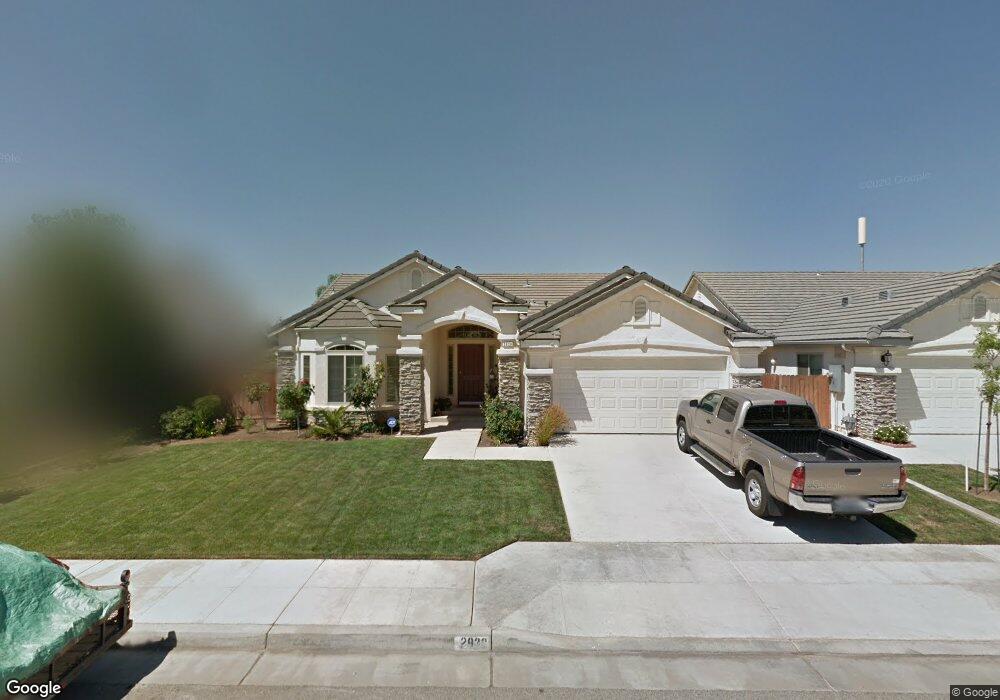
2938 E Decatur Ave Fresno, CA 93720
Woodward Park NeighborhoodEstimated Value: $512,540 - $540,000
3
Beds
2
Baths
2,040
Sq Ft
$259/Sq Ft
Est. Value
About This Home
This home is located at 2938 E Decatur Ave, Fresno, CA 93720 and is currently estimated at $528,885, approximately $259 per square foot. 2938 E Decatur Ave is a home located in Fresno County with nearby schools including Mountain View Elementary School, Granite Ridge Intermediate School, and Clovis North High School.
Ownership History
Date
Name
Owned For
Owner Type
Purchase Details
Closed on
Sep 28, 2015
Sold by
Lopez Faustino L and Lopez Susie M
Bought by
Hernandez Nicole and Lopez Irrevocable Trust
Current Estimated Value
Purchase Details
Closed on
Apr 20, 2009
Sold by
Mardirosian Sebouh
Bought by
Lopez Faustino L and Lopez Susie M
Purchase Details
Closed on
Mar 6, 2006
Sold by
Tiutin Dorin and Tiutin Otilia
Bought by
Mardirosian Sebouh and Mardirosian Arshalous Y
Home Financials for this Owner
Home Financials are based on the most recent Mortgage that was taken out on this home.
Original Mortgage
$282,000
Interest Rate
6.18%
Mortgage Type
Stand Alone First
Purchase Details
Closed on
Jan 5, 2005
Sold by
Bh5067 Lp
Bought by
Tiutin Dorin and Tiutin Otilia
Home Financials for this Owner
Home Financials are based on the most recent Mortgage that was taken out on this home.
Original Mortgage
$316,540
Interest Rate
5.73%
Mortgage Type
New Conventional
Create a Home Valuation Report for This Property
The Home Valuation Report is an in-depth analysis detailing your home's value as well as a comparison with similar homes in the area
Home Values in the Area
Average Home Value in this Area
Purchase History
| Date | Buyer | Sale Price | Title Company |
|---|---|---|---|
| Hernandez Nicole | -- | None Available | |
| Lopez Faustino L | $260,000 | Placer Title Company | |
| Mardirosian Sebouh | $432,000 | Stewart Title | |
| Tiutin Dorin | $326,500 | Chicago Title Co |
Source: Public Records
Mortgage History
| Date | Status | Borrower | Loan Amount |
|---|---|---|---|
| Previous Owner | Mardirosian Sebouh | $282,000 | |
| Previous Owner | Tiutin Dorin | $316,540 |
Source: Public Records
Tax History Compared to Growth
Tax History
| Year | Tax Paid | Tax Assessment Tax Assessment Total Assessment is a certain percentage of the fair market value that is determined by local assessors to be the total taxable value of land and additions on the property. | Land | Improvement |
|---|---|---|---|---|
| 2025 | $4,024 | $334,802 | $103,013 | $231,789 |
| 2023 | $3,944 | $321,804 | $99,014 | $222,790 |
| 2022 | $3,871 | $315,495 | $97,073 | $218,422 |
| 2021 | $3,742 | $309,310 | $95,170 | $214,140 |
| 2020 | $3,724 | $306,140 | $94,195 | $211,945 |
| 2019 | $3,674 | $300,139 | $92,349 | $207,790 |
| 2018 | $3,592 | $294,255 | $90,539 | $203,716 |
| 2017 | $3,526 | $288,486 | $88,764 | $199,722 |
| 2016 | $3,405 | $282,830 | $87,024 | $195,806 |
| 2015 | $3,350 | $278,582 | $85,717 | $192,865 |
| 2014 | $3,286 | $273,126 | $84,038 | $189,088 |
Source: Public Records
Map
Nearby Homes
- 7993 N Justin Ave
- 2658 E Alluvial Ave Unit 220
- 2672 E Jordan Ave
- 522 W Jordan Ave
- 2906 E Niles Ave
- 503 W Athens Ave
- 1257 N Cindy Ave
- 2707 E Omaha Ave
- 2550 E Jenny Ave
- 1013 N Karen Ave
- 2825 E Quincy Ave
- 2669 E Sean Ave
- 450 W Alluvial Ave
- 2625 E Sean Ave
- 2663 E Spice Way
- 365 W Goshen Ave
- 563 N Chapel Hill Ln
- 8420 N Ann Ave
- 460 W Balsam Ln
- 510 W Mahogany Ln
- 2954 E Decatur Ave
- 2922 E Decatur Ave
- 2941 E El Paso Ave
- 2957 E El Paso Ave
- 2906 E Decatur Ave
- 2957 E Decatur Ave
- 2941 E Decatur Ave
- 2967 E Decatur Ave
- 2909 E El Paso Ave
- 2925 E Decatur Ave
- 2890 E Decatur Ave
- 2973 E Decatur Ave
- 2893 E El Paso Ave
- 2909 E Decatur Ave
- 2874 E Decatur Ave
- 2960 E Cromwell Ave
- 2944 E Cromwell Ave
- 2893 E Decatur Ave
- 2940 E El Paso Ave
- 2985 E Decatur Ave