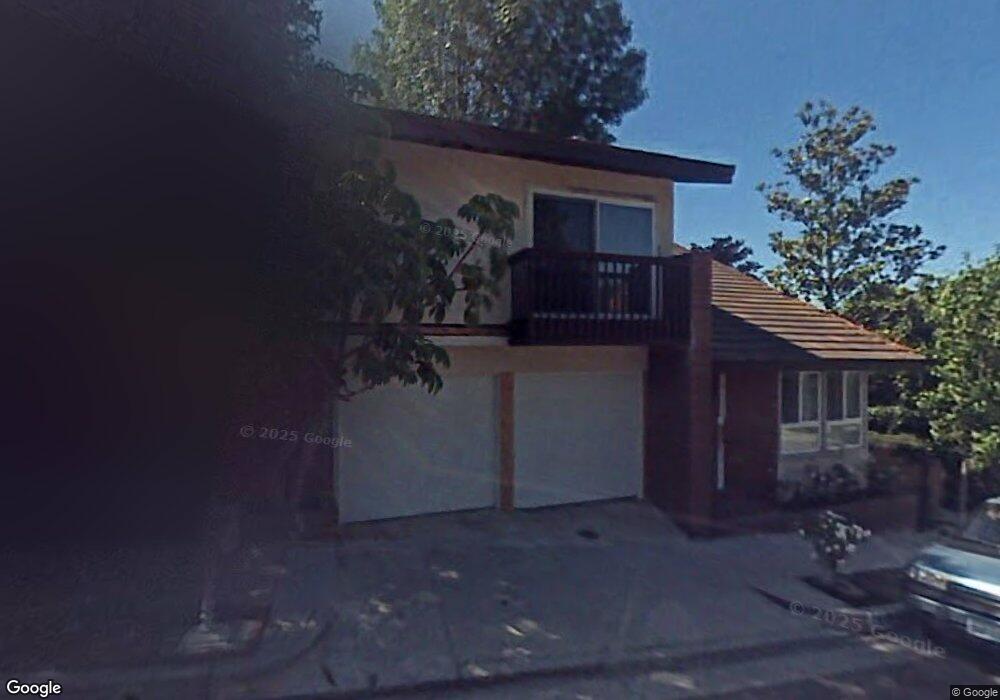
2938 Woodwardia Dr Los Angeles, CA 90077
Beverly Crest NeighborhoodEstimated Value: $1,913,579 - $2,199,000
4
Beds
3
Baths
2,685
Sq Ft
$766/Sq Ft
Est. Value
About This Home
This home is located at 2938 Woodwardia Dr, Los Angeles, CA 90077 and is currently estimated at $2,055,395, approximately $765 per square foot. 2938 Woodwardia Dr is a home located in Los Angeles County with nearby schools including Roscomare Road Elementary, Sherman Oaks Elementary Charter School, and The Seed School of Los Angeles County.
Ownership History
Date
Name
Owned For
Owner Type
Purchase Details
Closed on
Jun 17, 2020
Sold by
Engler Gary R and Engler Elisabetta
Bought by
Engler Gary and Engler Elisabetta
Current Estimated Value
Purchase Details
Closed on
May 25, 2000
Sold by
Biggers Michael A and Biggers Alison F
Bought by
Engler Gary R and Engler Elisabette
Home Financials for this Owner
Home Financials are based on the most recent Mortgage that was taken out on this home.
Original Mortgage
$504,000
Outstanding Balance
$170,727
Interest Rate
7.87%
Estimated Equity
$1,884,668
Purchase Details
Closed on
May 19, 1997
Sold by
Tollman Ivan J and Tollman Lilian M
Bought by
Biggers Michael A and Biggers Alison F
Home Financials for this Owner
Home Financials are based on the most recent Mortgage that was taken out on this home.
Original Mortgage
$373,600
Interest Rate
7.75%
Create a Home Valuation Report for This Property
The Home Valuation Report is an in-depth analysis detailing your home's value as well as a comparison with similar homes in the area
Home Values in the Area
Average Home Value in this Area
Purchase History
| Date | Buyer | Sale Price | Title Company |
|---|---|---|---|
| Engler Gary | -- | Orange Coast Title | |
| Engler Gary R | $630,000 | Equity Title | |
| Biggers Michael A | $467,000 | Old Republic Title Company |
Source: Public Records
Mortgage History
| Date | Status | Borrower | Loan Amount |
|---|---|---|---|
| Open | Engler Gary R | $504,000 | |
| Previous Owner | Biggers Michael A | $373,600 | |
| Closed | Engler Gary R | $63,000 |
Source: Public Records
Tax History Compared to Growth
Tax History
| Year | Tax Paid | Tax Assessment Tax Assessment Total Assessment is a certain percentage of the fair market value that is determined by local assessors to be the total taxable value of land and additions on the property. | Land | Improvement |
|---|---|---|---|---|
| 2025 | $11,791 | $968,277 | $689,480 | $278,797 |
| 2024 | $11,791 | $949,292 | $675,961 | $273,331 |
| 2023 | $11,569 | $930,679 | $662,707 | $267,972 |
| 2022 | $11,065 | $912,431 | $649,713 | $262,718 |
| 2021 | $10,919 | $894,541 | $636,974 | $257,567 |
| 2020 | $10,959 | $885,369 | $630,443 | $254,926 |
| 2019 | $10,587 | $868,010 | $618,082 | $249,928 |
| 2018 | $10,547 | $850,991 | $605,963 | $245,028 |
| 2016 | $10,042 | $817,948 | $582,434 | $235,514 |
| 2015 | $9,897 | $805,663 | $573,686 | $231,977 |
| 2014 | $9,937 | $789,882 | $562,449 | $227,433 |
Source: Public Records
Map
Nearby Homes
- 2880 Woodwardia Dr
- 2801 Woodwardia Dr
- 2790 Woodwardia Dr
- 3025 N Beverly Glen Cr
- 2718 Claray Dr
- 0 Camino de la Cumbre Unit 25547097
- 14330 Mulholland Dr
- 10507 Woodfield Ct Unit 12
- 2719 Benedict Canyon Dr
- 9991 Liebe Dr
- 2661 Angelo Dr
- 2654 Basil Ln
- 9951 Liebe Dr
- 2518 Almaden Ct
- 3110 Benedict Canyon Dr
- 3201 Benedict Canyon Dr
- 3303 Coy Dr
- 3445 Beverly Glen Blvd
- 14132 Beresford Rd
- 14513 Mulholland Dr
- 10231 Autumn Leaf Cir Unit 4
- 10429 Summer Holly Cir Unit 49
- 10400 Summer Holly Cir
- 2894 Woodwardia Dr
- 10239 Autumn Leaf Cir Unit 2
- 10243 Autumn Leaf Cir
- 10429 Summer Holly Cir
- 10425 Summer Holly Cir Unit 48
- 10421 Summer Holly Cir Unit 47
- 10422 Summer Holly Cir Unit 46
- 10416 Summer Holly Cir Unit 45
- 10412 Summer Holly Cir
- 10408 Summer Holly Cir
- 10404 Summer Holly Cir Unit 42
- 10397 Summer Holly Cir
- 10389 Summer Holly Cir
- 2829 Angelo Dr
- 10211 Autumn Leaf Cir
- 10223 Autumn Leaf Cir Unit 6
- 10227 Autumn Leaf Cir Unit 5