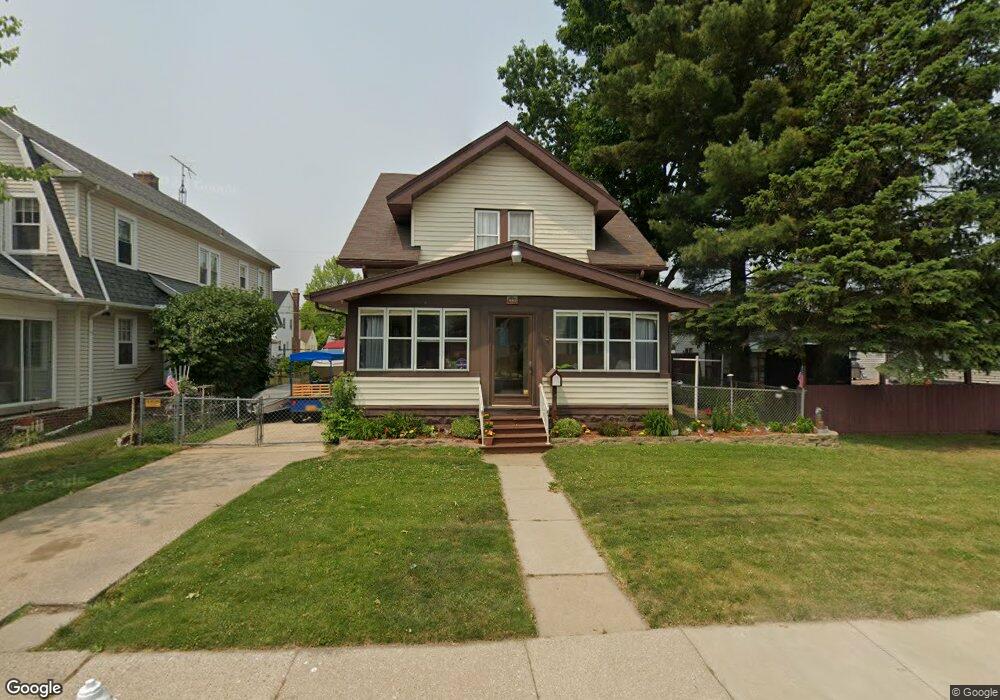
2939 118th St Toledo, OH 43611
Point Place NeighborhoodEstimated Value: $130,000 - $178,000
3
Beds
2
Baths
1,536
Sq Ft
$104/Sq Ft
Est. Value
About This Home
This home is located at 2939 118th St, Toledo, OH 43611 and is currently estimated at $160,106, approximately $104 per square foot. 2939 118th St is a home located in Lucas County with nearby schools including Edgewater Elementary School, Woodward High School, and Imagine Environmental Science Academy.
Ownership History
Date
Name
Owned For
Owner Type
Purchase Details
Closed on
Feb 22, 2008
Sold by
Fannie Mae
Bought by
Hall Mishelle K
Current Estimated Value
Home Financials for this Owner
Home Financials are based on the most recent Mortgage that was taken out on this home.
Original Mortgage
$72,000
Outstanding Balance
$44,674
Interest Rate
5.75%
Mortgage Type
New Conventional
Estimated Equity
$115,432
Purchase Details
Closed on
Apr 9, 2007
Sold by
Jasinkowski Jennifer L
Bought by
Federal National Mortgage Association
Purchase Details
Closed on
Mar 7, 2002
Sold by
Jasinkowski David H
Bought by
Jasinkowski Jennifer L
Create a Home Valuation Report for This Property
The Home Valuation Report is an in-depth analysis detailing your home's value as well as a comparison with similar homes in the area
Home Values in the Area
Average Home Value in this Area
Purchase History
| Date | Buyer | Sale Price | Title Company |
|---|---|---|---|
| Hall Mishelle K | $72,000 | Louisville | |
| Federal National Mortgage Association | $80,000 | Ohio Title Corp | |
| Jasinkowski Jennifer L | -- | -- |
Source: Public Records
Mortgage History
| Date | Status | Borrower | Loan Amount |
|---|---|---|---|
| Open | Hall Mishelle K | $72,000 |
Source: Public Records
Tax History Compared to Growth
Tax History
| Year | Tax Paid | Tax Assessment Tax Assessment Total Assessment is a certain percentage of the fair market value that is determined by local assessors to be the total taxable value of land and additions on the property. | Land | Improvement |
|---|---|---|---|---|
| 2024 | $1,169 | $38,255 | $5,355 | $32,900 |
| 2023 | $1,981 | $30,835 | $4,900 | $25,935 |
| 2022 | $1,983 | $30,835 | $4,900 | $25,935 |
| 2021 | $2,029 | $30,835 | $4,900 | $25,935 |
| 2020 | $1,912 | $25,515 | $4,060 | $21,455 |
| 2019 | $1,859 | $25,515 | $4,060 | $21,455 |
| 2018 | $1,723 | $25,515 | $4,060 | $21,455 |
| 2017 | $1,590 | $20,370 | $4,760 | $15,610 |
| 2016 | $1,592 | $58,200 | $13,600 | $44,600 |
| 2015 | $1,579 | $58,200 | $13,600 | $44,600 |
| 2014 | $1,281 | $20,370 | $4,760 | $15,610 |
| 2013 | $1,281 | $20,370 | $4,760 | $15,610 |
Source: Public Records
Map
Nearby Homes