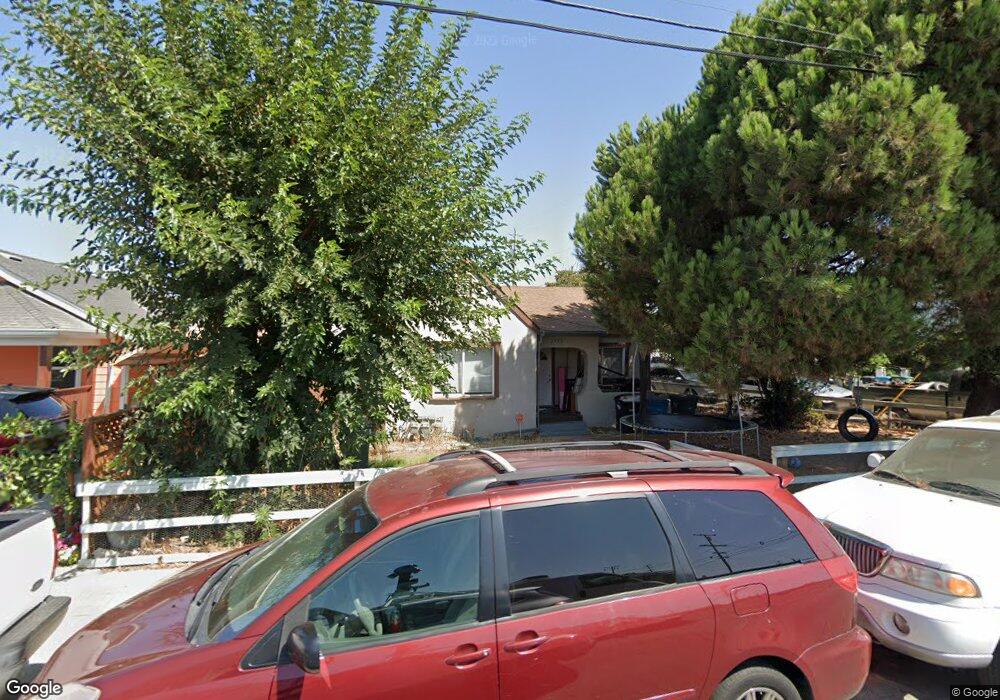
2939 Crocker Ave Redwood City, CA 94063
North Fair Oaks NeighborhoodEstimated Value: $408,969 - $1,574,000
4
Beds
3
Baths
2,435
Sq Ft
$469/Sq Ft
Est. Value
About This Home
This home is located at 2939 Crocker Ave, Redwood City, CA 94063 and is currently estimated at $1,140,992, approximately $468 per square foot. 2939 Crocker Ave is a home located in San Mateo County with nearby schools including Taft Elementary School, John F. Kennedy Middle School, and Sequoia High School.
Ownership History
Date
Name
Owned For
Owner Type
Purchase Details
Closed on
Jun 3, 1996
Sold by
Condon Shelley Y
Bought by
Williford Clark
Current Estimated Value
Home Financials for this Owner
Home Financials are based on the most recent Mortgage that was taken out on this home.
Original Mortgage
$84,500
Outstanding Balance
$5,522
Interest Rate
8.25%
Mortgage Type
Seller Take Back
Estimated Equity
$1,135,470
Purchase Details
Closed on
Aug 30, 1994
Sold by
Condon Shelley Y
Bought by
Condon Shelley Y
Create a Home Valuation Report for This Property
The Home Valuation Report is an in-depth analysis detailing your home's value as well as a comparison with similar homes in the area
Home Values in the Area
Average Home Value in this Area
Purchase History
| Date | Buyer | Sale Price | Title Company |
|---|---|---|---|
| Williford Clark | $104,500 | Fidelity National Title Co | |
| Condon Shelley Y | -- | -- |
Source: Public Records
Mortgage History
| Date | Status | Borrower | Loan Amount |
|---|---|---|---|
| Open | Williford Clark | $84,500 |
Source: Public Records
Tax History Compared to Growth
Tax History
| Year | Tax Paid | Tax Assessment Tax Assessment Total Assessment is a certain percentage of the fair market value that is determined by local assessors to be the total taxable value of land and additions on the property. | Land | Improvement |
|---|---|---|---|---|
| 2025 | $6,792 | $173,571 | $132,886 | $40,685 |
| 2023 | $6,792 | $166,833 | $127,727 | $39,106 |
| 2022 | $6,232 | $163,563 | $125,223 | $38,340 |
| 2021 | $6,125 | $160,357 | $122,768 | $37,589 |
| 2020 | $6,011 | $158,714 | $121,510 | $37,204 |
| 2019 | $5,819 | $155,603 | $119,128 | $36,475 |
| 2018 | $5,459 | $152,553 | $116,793 | $35,760 |
| 2017 | $4,878 | $149,562 | $114,503 | $35,059 |
| 2016 | $4,594 | $146,630 | $112,258 | $34,372 |
| 2015 | $4,416 | $144,428 | $110,572 | $33,856 |
| 2014 | $3,736 | $141,600 | $108,407 | $33,193 |
Source: Public Records
Map
Nearby Homes