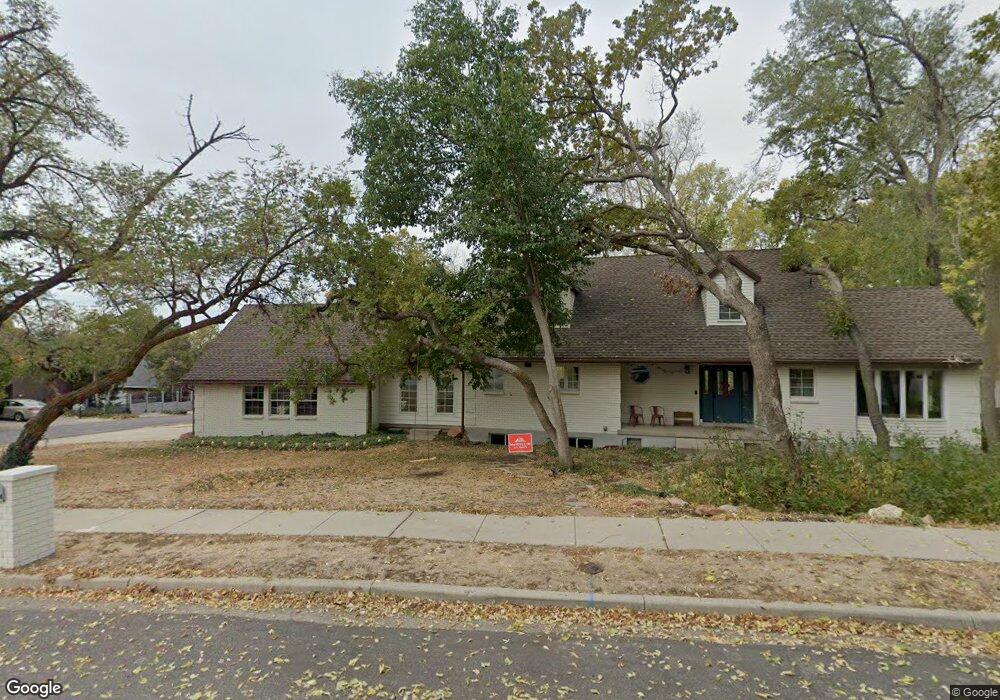
294 S 600 E Centerville, UT 84014
Estimated Value: $798,000 - $882,000
4
Beds
4
Baths
3,886
Sq Ft
$214/Sq Ft
Est. Value
About This Home
This home is located at 294 S 600 E, Centerville, UT 84014 and is currently estimated at $831,803, approximately $214 per square foot. 294 S 600 E is a home located in Davis County with nearby schools including J A Taylor Elementary School, Centerville Jr High, and Viewmont High School.
Ownership History
Date
Name
Owned For
Owner Type
Purchase Details
Closed on
Jun 10, 2022
Sold by
Thomas Bean Jon
Bought by
Bean Jon Thomas and Bean Cynthia Estelle
Current Estimated Value
Home Financials for this Owner
Home Financials are based on the most recent Mortgage that was taken out on this home.
Original Mortgage
$512,000
Outstanding Balance
$486,606
Interest Rate
5.3%
Mortgage Type
New Conventional
Estimated Equity
$345,197
Purchase Details
Closed on
May 14, 2019
Sold by
Michael Byron Barton Trust
Bought by
Nielsen Paige and Nielsen Ryan A
Home Financials for this Owner
Home Financials are based on the most recent Mortgage that was taken out on this home.
Original Mortgage
$382,580
Interest Rate
3.75%
Mortgage Type
FHA
Purchase Details
Closed on
Mar 5, 2009
Sold by
Barton Michael Byron and Barton Lee Ann H
Bought by
Barton Michael Byron and Barton Lee Ann H
Create a Home Valuation Report for This Property
The Home Valuation Report is an in-depth analysis detailing your home's value as well as a comparison with similar homes in the area
Purchase History
| Date | Buyer | Sale Price | Title Company |
|---|---|---|---|
| Bean Jon Thomas | -- | New Title Company Name | |
| Bean Joa Thomas | -- | New Title Company Name | |
| Nielsen Paige | -- | Pinnacle Title Ins | |
| Barton Michael Byron | -- | None Available |
Source: Public Records
Mortgage History
| Date | Status | Borrower | Loan Amount |
|---|---|---|---|
| Open | Bean Jon Thomas | $512,000 | |
| Previous Owner | Nielsen Paige | $382,580 |
Source: Public Records
Tax History
| Year | Tax Paid | Tax Assessment Tax Assessment Total Assessment is a certain percentage of the fair market value that is determined by local assessors to be the total taxable value of land and additions on the property. | Land | Improvement |
|---|---|---|---|---|
| 2025 | $4,197 | $401,500 | $170,839 | $230,661 |
| 2024 | $3,969 | $386,100 | $157,519 | $228,581 |
| 2023 | $3,828 | $673,000 | $253,166 | $419,834 |
| 2022 | $3,665 | $354,750 | $128,892 | $225,858 |
| 2021 | $3,303 | $498,000 | $202,694 | $295,306 |
| 2020 | $2,932 | $442,000 | $194,953 | $247,047 |
| 2019 | $2,975 | $438,000 | $185,456 | $252,544 |
| 2018 | $2,798 | $407,000 | $171,121 | $235,879 |
| 2016 | $2,350 | $189,970 | $63,196 | $126,774 |
| 2015 | $2,218 | $169,125 | $63,196 | $105,929 |
| 2014 | $2,176 | $169,822 | $63,196 | $106,626 |
| 2013 | -- | $161,840 | $47,103 | $114,737 |
Source: Public Records
Map
Nearby Homes
Your Personal Tour Guide
Ask me questions while you tour the home.