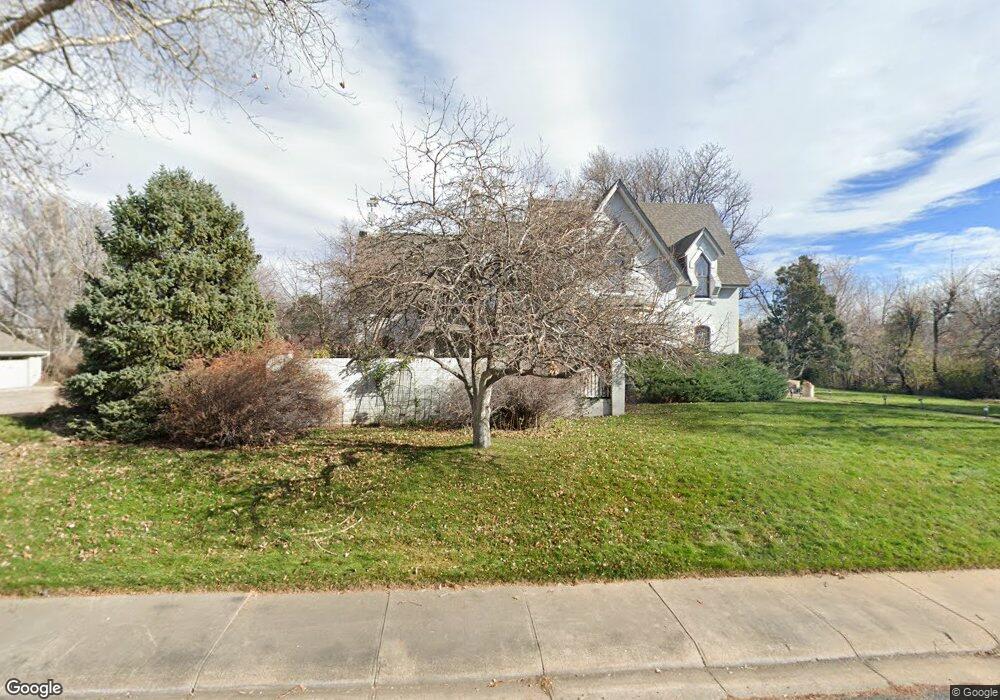
2940 20th St Boulder, CO 80304
Central Boulder NeighborhoodEstimated Value: $2,248,000 - $2,462,908
4
Beds
2
Baths
2,995
Sq Ft
$780/Sq Ft
Est. Value
About This Home
This home is located at 2940 20th St, Boulder, CO 80304 and is currently estimated at $2,334,977, approximately $779 per square foot. 2940 20th St is a home located in Boulder County with nearby schools including Columbine Elementary School, Casey Middle School, and Boulder High School.
Ownership History
Date
Name
Owned For
Owner Type
Purchase Details
Closed on
Oct 7, 2025
Sold by
Kathryn Howes Barth Revocable Trust and Howes Barth Kathryn
Bought by
Howes Barth Kathryn
Current Estimated Value
Purchase Details
Closed on
Mar 6, 2023
Sold by
Barth Kathryn Howes
Bought by
Kathryn Howes Barth Revocable Trust
Purchase Details
Closed on
Nov 6, 1992
Bought by
Howes Barth Kathryn
Purchase Details
Closed on
Apr 19, 1988
Bought by
Howes Barth Kathryn
Purchase Details
Closed on
Mar 6, 1960
Bought by
Howes Barth Kathryn
Create a Home Valuation Report for This Property
The Home Valuation Report is an in-depth analysis detailing your home's value as well as a comparison with similar homes in the area
Home Values in the Area
Average Home Value in this Area
Purchase History
| Date | Buyer | Sale Price | Title Company |
|---|---|---|---|
| Howes Barth Kathryn | -- | None Listed On Document | |
| Kathryn Howes Barth Revocable Trust | $500 | -- | |
| Howes Barth Kathryn | -- | -- | |
| Howes Barth Kathryn | $237,500 | -- | |
| Howes Barth Kathryn | -- | -- |
Source: Public Records
Tax History Compared to Growth
Tax History
| Year | Tax Paid | Tax Assessment Tax Assessment Total Assessment is a certain percentage of the fair market value that is determined by local assessors to be the total taxable value of land and additions on the property. | Land | Improvement |
|---|---|---|---|---|
| 2025 | $15,759 | $153,050 | $111,869 | $41,181 |
| 2024 | $15,759 | $153,050 | $111,869 | $41,181 |
| 2023 | $15,486 | $186,019 | $122,677 | $67,027 |
| 2022 | $14,126 | $159,065 | $89,419 | $69,646 |
| 2021 | $13,470 | $163,642 | $91,992 | $71,650 |
| 2020 | $10,931 | $132,726 | $106,178 | $26,548 |
| 2019 | $10,763 | $132,726 | $106,178 | $26,548 |
| 2018 | $9,791 | $120,132 | $78,696 | $41,436 |
| 2017 | $9,485 | $132,813 | $87,003 | $45,810 |
| 2016 | $10,336 | $127,360 | $81,749 | $45,611 |
| 2015 | $9,787 | $125,131 | $64,237 | $60,894 |
| 2014 | $9,852 | $125,131 | $64,237 | $60,894 |
Source: Public Records
Map
Nearby Homes
- 2941 21st St
- 2935 19th St
- 2870 18th St
- 3055 23rd St
- 1895 Alpine Ave Unit G21
- 1895 Alpine Ave Unit E18
- 3010 14th St
- 1930 Grape Ave
- 2991 25th St
- 1707 Grape Ave
- 2240 Bluff St
- 1557 North St
- 2680 Fremont St
- 2225 Pine St
- 2006 Joslyn Place
- 2917 13th St
- 1303 Alpine Ave Unit 24A
- 1526 Sunset Blvd
- 1267 Balsam Ave
- 1845 Iris Ave