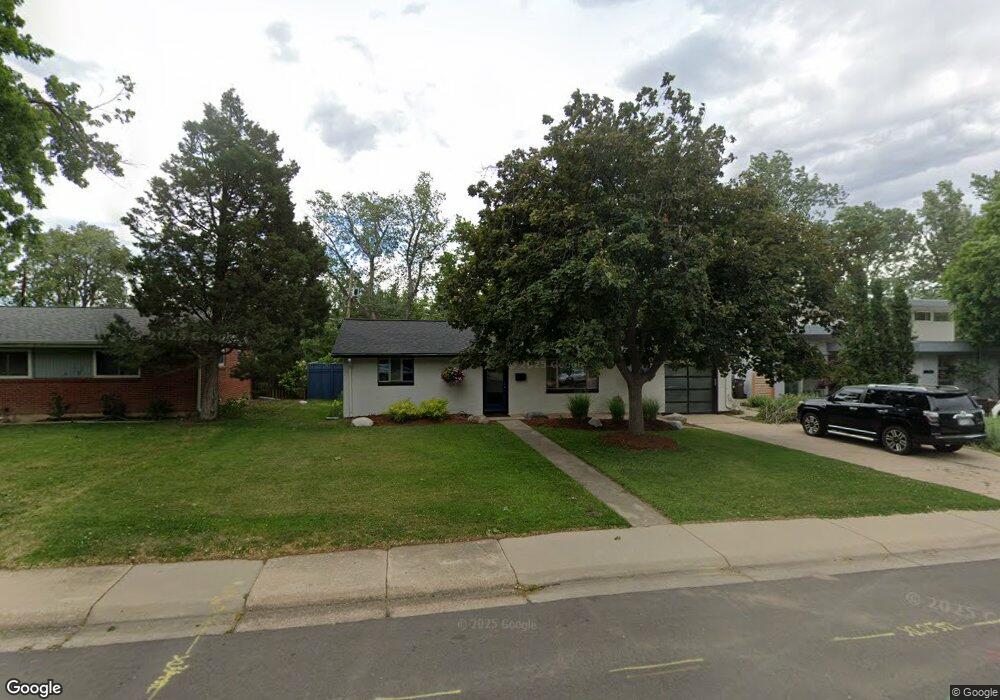
2940 21st St Boulder, CO 80304
Central Boulder NeighborhoodEstimated Value: $893,060 - $973,000
3
Beds
2
Baths
1,050
Sq Ft
$901/Sq Ft
Est. Value
About This Home
This home is located at 2940 21st St, Boulder, CO 80304 and is currently estimated at $946,515, approximately $901 per square foot. 2940 21st St is a home located in Boulder County with nearby schools including Columbine Elementary School, Casey Middle School, and Boulder High School.
Ownership History
Date
Name
Owned For
Owner Type
Purchase Details
Closed on
Nov 20, 2003
Sold by
Spear Rhett and Simmons Speer Carole
Bought by
Simmons John W
Current Estimated Value
Home Financials for this Owner
Home Financials are based on the most recent Mortgage that was taken out on this home.
Original Mortgage
$221,000
Outstanding Balance
$112,983
Interest Rate
7.5%
Mortgage Type
New Conventional
Estimated Equity
$833,532
Purchase Details
Closed on
Aug 13, 1997
Sold by
Malm R F and Malm Wilma L
Bought by
Speer Rhett
Home Financials for this Owner
Home Financials are based on the most recent Mortgage that was taken out on this home.
Original Mortgage
$164,571
Interest Rate
7.6%
Mortgage Type
FHA
Purchase Details
Closed on
Jul 25, 1991
Bought by
Simmons John W
Create a Home Valuation Report for This Property
The Home Valuation Report is an in-depth analysis detailing your home's value as well as a comparison with similar homes in the area
Home Values in the Area
Average Home Value in this Area
Purchase History
| Date | Buyer | Sale Price | Title Company |
|---|---|---|---|
| Simmons John W | -- | -- | |
| Speer Rhett | $180,000 | -- | |
| Simmons John W | -- | -- |
Source: Public Records
Mortgage History
| Date | Status | Borrower | Loan Amount |
|---|---|---|---|
| Open | Simmons John W | $221,000 | |
| Closed | Speer Rhett | $164,571 |
Source: Public Records
Tax History
| Year | Tax Paid | Tax Assessment Tax Assessment Total Assessment is a certain percentage of the fair market value that is determined by local assessors to be the total taxable value of land and additions on the property. | Land | Improvement |
|---|---|---|---|---|
| 2025 | $5,536 | $54,788 | $49,309 | $5,479 |
| 2024 | $5,536 | $54,788 | $49,309 | $5,479 |
| 2023 | $5,440 | $62,993 | $59,463 | $7,216 |
| 2022 | $4,722 | $50,846 | $44,883 | $5,963 |
| 2021 | $4,503 | $52,310 | $46,175 | $6,135 |
| 2020 | $3,960 | $45,489 | $36,394 | $9,095 |
| 2019 | $3,899 | $45,489 | $36,394 | $9,095 |
| 2018 | $3,488 | $40,234 | $32,184 | $8,050 |
| 2017 | $3,379 | $44,480 | $35,581 | $8,899 |
| 2016 | $3,188 | $36,823 | $29,452 | $7,371 |
| 2015 | $3,018 | $31,403 | $15,602 | $15,801 |
| 2014 | $2,640 | $31,403 | $15,602 | $15,801 |
Source: Public Records
Map
Nearby Homes
- 3055 23rd St
- 2901 Lorraine Ct
- 2085 Balsam Dr
- 2940 18th St
- 2003 Balsam Dr
- 1950 Glenwood Dr
- 2870 18th St
- 3150 19th St
- 2895 18th St
- 3150 18th St
- 3125 Fremont St
- 2935 17th St
- 2965 17th St
- 2991 25th St
- 1805 Forest Ave
- 2340 Panorama Ave
- 1895 Alpine Ave Unit G22
- 1895 Alpine Ave Unit G21
- 1895 Alpine Ave Unit E18
- 2727 Folsom St Unit 303
Your Personal Tour Guide
Ask me questions while you tour the home.