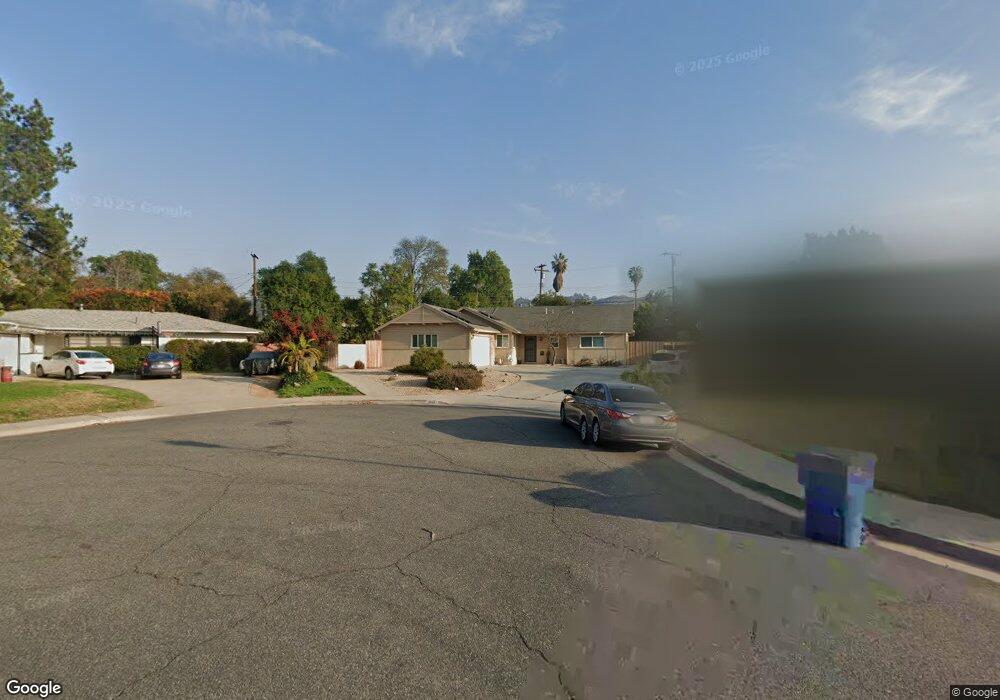
2940 Cheyenne Rd Riverside, CA 92506
Victoria NeighborhoodEstimated Value: $634,912 - $675,000
3
Beds
2
Baths
1,596
Sq Ft
$411/Sq Ft
Est. Value
About This Home
This home is located at 2940 Cheyenne Rd, Riverside, CA 92506 and is currently estimated at $655,228, approximately $410 per square foot. 2940 Cheyenne Rd is a home located in Riverside County with nearby schools including Victoria Elementary School, Matthew Gage Middle School, and Polytechnic High School.
Ownership History
Date
Name
Owned For
Owner Type
Purchase Details
Closed on
Feb 21, 2015
Sold by
Aldana David S and Aldana Lori L
Bought by
The David & Lori Aldana Revocable Living
Current Estimated Value
Purchase Details
Closed on
Dec 23, 2010
Sold by
Babcock Alan and Babcock Jolene
Bought by
Aldana David S and Aldana Lori L
Home Financials for this Owner
Home Financials are based on the most recent Mortgage that was taken out on this home.
Original Mortgage
$233,916
Outstanding Balance
$157,659
Interest Rate
4.62%
Mortgage Type
FHA
Estimated Equity
$497,569
Purchase Details
Closed on
Mar 14, 2008
Sold by
Babcock Alan
Bought by
Babcock Alan and Babcock Jolene
Home Financials for this Owner
Home Financials are based on the most recent Mortgage that was taken out on this home.
Original Mortgage
$50,000
Interest Rate
5.65%
Mortgage Type
Stand Alone Refi Refinance Of Original Loan
Purchase Details
Closed on
Feb 11, 2003
Sold by
Babcock Patricia Beers and Angell Patricia Beers
Bought by
Babcock Patricia and Babcock Alan
Create a Home Valuation Report for This Property
The Home Valuation Report is an in-depth analysis detailing your home's value as well as a comparison with similar homes in the area
Home Values in the Area
Average Home Value in this Area
Purchase History
| Date | Buyer | Sale Price | Title Company |
|---|---|---|---|
| The David & Lori Aldana Revocable Living | -- | None Available | |
| Aldana David S | $240,000 | Western Resources Title Co | |
| Babcock Alan | -- | Fidelity National Title Insu | |
| Babcock Alan | -- | Fidelity National Title Insu | |
| Babcock Patricia | -- | -- |
Source: Public Records
Mortgage History
| Date | Status | Borrower | Loan Amount |
|---|---|---|---|
| Open | Aldana David S | $233,916 | |
| Previous Owner | Babcock Alan | $50,000 |
Source: Public Records
Tax History
| Year | Tax Paid | Tax Assessment Tax Assessment Total Assessment is a certain percentage of the fair market value that is determined by local assessors to be the total taxable value of land and additions on the property. | Land | Improvement |
|---|---|---|---|---|
| 2025 | $3,365 | $307,463 | $64,049 | $243,414 |
| 2023 | $3,365 | $295,526 | $61,563 | $233,963 |
| 2022 | $3,289 | $289,732 | $60,356 | $229,376 |
| 2021 | $3,253 | $284,052 | $59,173 | $224,879 |
| 2020 | $3,228 | $281,141 | $58,567 | $222,574 |
| 2019 | $3,168 | $275,629 | $57,419 | $218,210 |
| 2018 | $3,107 | $270,226 | $56,294 | $213,932 |
| 2017 | $3,052 | $264,929 | $55,191 | $209,738 |
| 2016 | $2,858 | $259,735 | $54,109 | $205,626 |
| 2015 | $2,817 | $255,837 | $53,298 | $202,539 |
| 2014 | $2,791 | $250,827 | $52,255 | $198,572 |
Source: Public Records
Map
Nearby Homes
- 2924 Pecos Way
- 2667 Victoria Park Dr
- 5404 Quince St
- 2565 Laramie Rd
- 5978 Copperfield Ave
- 2429 Chauncy Place
- 6539 Marguerita Ave
- 5133 Monterey Rd
- 2424 Central Ave
- 6146 Hawarden Dr
- 3180 Jane St
- 6174 Hawarden Dr
- 5305 Bardwell Ave
- 6565 Lorraine Dr
- 2994 David St
- 2542 Adage Way
- 3595 Timothy Way
- 3370 Pachappa Hill
- 3076 Ronald St
- 3088 Panorama Rd
- 2950 Cheyenne Rd
- 2930 Cheyenne Rd
- 2929 Cimarron Rd
- 5715 Anna St
- 2939 Cimarron Rd
- 5727 Anna St
- 5703 Anna St
- 2960 Cheyenne Rd
- 2951 Cimarron Rd
- 5739 Anna St
- 2920 Cheyenne Rd
- 5691 Anna St
- 2959 Cheyenne Rd
- 2963 Cimarron Rd
- 2970 Cheyenne Rd
- 2940 Laramie Rd
- 2926 Laramie Rd
- 2890 Shenandoah Rd
- 2936 Cimarron Rd
- 2924 Cimarron Rd
Your Personal Tour Guide
Ask me questions while you tour the home.