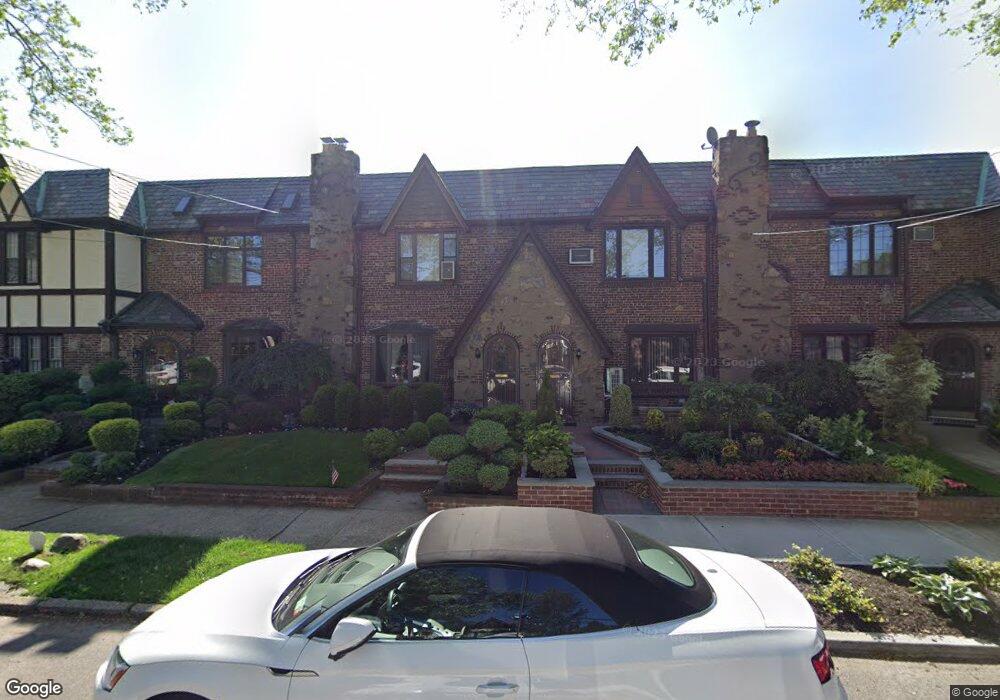
2944 167th St Flushing, NY 11358
Murray Hill-Broadway NeighborhoodEstimated Value: $952,000 - $1,061,000
Studio
--
Bath
1,480
Sq Ft
$687/Sq Ft
Est. Value
About This Home
This home is located at 2944 167th St, Flushing, NY 11358 and is currently estimated at $1,016,924, approximately $687 per square foot. 2944 167th St is a home located in Queens County with nearby schools including P.S. 32 - State Street, I.S. 25 Adrien Block, and Francis Lewis High School.
Ownership History
Date
Name
Owned For
Owner Type
Purchase Details
Closed on
Dec 10, 2021
Sold by
Toumanidis Sandra and Toumanidis Savvas
Bought by
Chang Veronica Y and Mcmanus Michael W
Current Estimated Value
Purchase Details
Closed on
Jun 9, 2005
Sold by
Zabala John and Zabala Patricia
Bought by
Toumanidis Sandra and Toumanidis Savvas
Home Financials for this Owner
Home Financials are based on the most recent Mortgage that was taken out on this home.
Original Mortgage
$359,600
Interest Rate
5.82%
Mortgage Type
Purchase Money Mortgage
Purchase Details
Closed on
Apr 2, 2002
Sold by
Jeanine Greenfield
Bought by
Zabala John and Zabala Patricia
Home Financials for this Owner
Home Financials are based on the most recent Mortgage that was taken out on this home.
Original Mortgage
$340,000
Interest Rate
7.18%
Create a Home Valuation Report for This Property
The Home Valuation Report is an in-depth analysis detailing your home's value as well as a comparison with similar homes in the area
Home Values in the Area
Average Home Value in this Area
Purchase History
| Date | Buyer | Sale Price | Title Company |
|---|---|---|---|
| Chang Veronica Y | $891,000 | -- | |
| Toumanidis Sandra | $555,000 | -- | |
| Zabala John | -- | -- |
Source: Public Records
Mortgage History
| Date | Status | Borrower | Loan Amount |
|---|---|---|---|
| Previous Owner | Toumanidis Sandra | $359,600 | |
| Previous Owner | Zabala John | $340,000 |
Source: Public Records
Tax History
| Year | Tax Paid | Tax Assessment Tax Assessment Total Assessment is a certain percentage of the fair market value that is determined by local assessors to be the total taxable value of land and additions on the property. | Land | Improvement |
|---|---|---|---|---|
| 2025 | $7,944 | $40,738 | $11,480 | $29,258 |
| 2024 | $7,944 | $39,554 | $12,465 | $27,089 |
| 2023 | $7,513 | $37,404 | $11,814 | $25,590 |
| 2022 | $7,247 | $47,700 | $16,620 | $31,080 |
| 2021 | $6,852 | $51,000 | $16,620 | $34,380 |
| 2020 | $6,890 | $47,460 | $16,620 | $30,840 |
| 2019 | $6,602 | $48,780 | $16,620 | $32,160 |
| 2018 | $6,056 | $31,170 | $10,529 | $20,641 |
| 2017 | $5,762 | $29,738 | $11,042 | $18,696 |
| 2016 | $5,349 | $29,738 | $11,042 | $18,696 |
| 2015 | $3,164 | $28,290 | $13,323 | $14,967 |
| 2014 | $3,164 | $27,469 | $14,817 | $12,652 |
Source: Public Records
Map
Nearby Homes
- 16608 29th Ave
- 29-37 168th St
- 29 Avenue
- 27-25 168th St
- 32-16 167th St
- 2724 166th St
- 16419 32nd Ave
- 29-31 170th St
- 32-35 164th St
- 16407 27th Ave
- 2952 172nd St
- 164-04 33rd Ave
- 29-35 162nd St
- 25-26 Bayside Ln
- 28-07 172nd St
- 2533 Francis Lewis Blvd
- 3228 Utopia Pkwy
- 32-15 161st St
- 2934 161st St
- 24-65 Francis Lewis Blvd
Your Personal Tour Guide
Ask me questions while you tour the home.