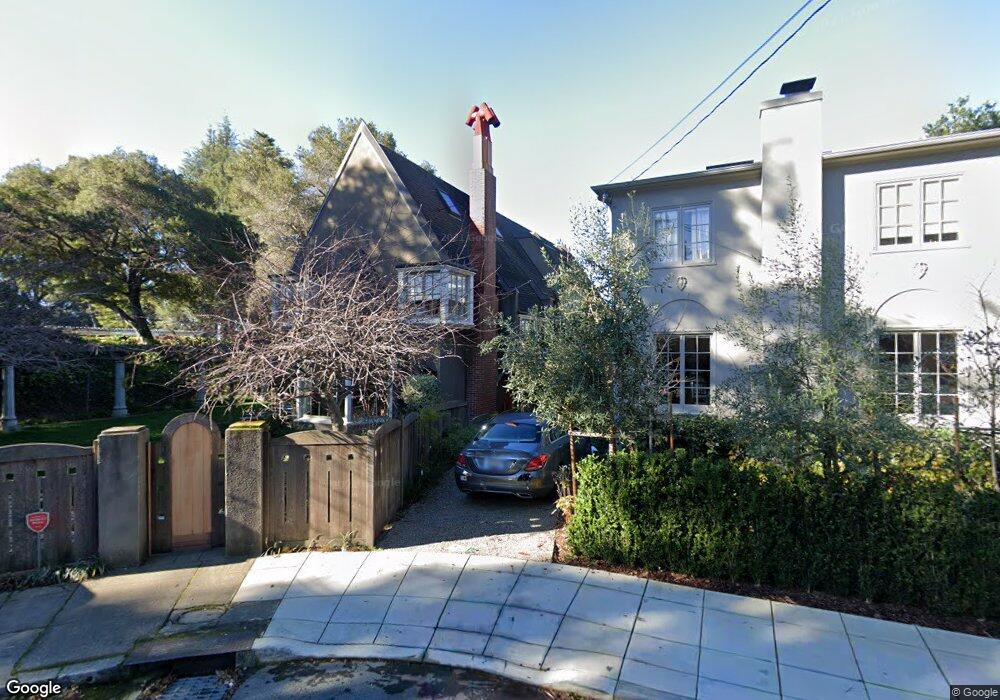
2944 Elmwood Ct Berkeley, CA 94705
Claremont NeighborhoodEstimated Value: $1,923,000 - $3,689,000
4
Beds
5
Baths
4,408
Sq Ft
$670/Sq Ft
Est. Value
About This Home
This home is located at 2944 Elmwood Ct, Berkeley, CA 94705 and is currently estimated at $2,951,333, approximately $669 per square foot. 2944 Elmwood Ct is a home located in Alameda County with nearby schools including John Muir Elementary School, Emerson Elementary School, and Malcolm X Elementary School.
Ownership History
Date
Name
Owned For
Owner Type
Purchase Details
Closed on
Aug 24, 2016
Sold by
Alderson Tom and Alderson Linda
Bought by
Alderson Tom and Alderson Linda
Current Estimated Value
Purchase Details
Closed on
Sep 22, 1998
Sold by
Teece David and Teece Tom
Bought by
Alderson Tom and Alderson Linda
Home Financials for this Owner
Home Financials are based on the most recent Mortgage that was taken out on this home.
Original Mortgage
$205,000
Outstanding Balance
$43,715
Interest Rate
6.88%
Estimated Equity
$2,907,618
Purchase Details
Closed on
Jan 1, 1995
Sold by
Teece David
Bought by
Alderson Tom and Alderson Linda
Home Financials for this Owner
Home Financials are based on the most recent Mortgage that was taken out on this home.
Original Mortgage
$123,916
Interest Rate
7.94%
Mortgage Type
Seller Take Back
Create a Home Valuation Report for This Property
The Home Valuation Report is an in-depth analysis detailing your home's value as well as a comparison with similar homes in the area
Home Values in the Area
Average Home Value in this Area
Purchase History
| Date | Buyer | Sale Price | Title Company |
|---|---|---|---|
| Alderson Tom | -- | None Available | |
| Alderson Tom | -- | None Available | |
| Alderson Tom | $102,500 | Placer Title Company | |
| Alderson Tom | $124,000 | -- |
Source: Public Records
Mortgage History
| Date | Status | Borrower | Loan Amount |
|---|---|---|---|
| Open | Alderson Tom | $205,000 | |
| Previous Owner | Alderson Tom | $123,916 |
Source: Public Records
Tax History
| Year | Tax Paid | Tax Assessment Tax Assessment Total Assessment is a certain percentage of the fair market value that is determined by local assessors to be the total taxable value of land and additions on the property. | Land | Improvement |
|---|---|---|---|---|
| 2025 | $16,197 | $1,016,999 | $180,276 | $843,723 |
| 2024 | $16,197 | $996,925 | $176,742 | $827,183 |
| 2023 | $15,852 | $984,243 | $173,277 | $810,966 |
| 2022 | $15,551 | $957,947 | $169,880 | $795,067 |
| 2021 | $15,578 | $939,030 | $166,549 | $779,481 |
| 2020 | $14,698 | $936,332 | $164,842 | $771,490 |
| 2019 | $14,088 | $917,975 | $161,610 | $756,365 |
| 2018 | $13,842 | $899,978 | $158,442 | $741,536 |
| 2017 | $13,367 | $882,334 | $155,336 | $726,998 |
| 2016 | $12,912 | $865,036 | $152,291 | $712,745 |
| 2015 | $12,736 | $852,043 | $150,003 | $702,040 |
| 2014 | $12,586 | $835,354 | $147,065 | $688,289 |
Source: Public Records
Map
Nearby Homes
- 2962 Piedmont Ave
- 2817 Palm Ct
- 2643 Stuart St
- 190 Stonewall Rd
- 2477 Prince St
- 2632 Warring St Unit 3
- 204 El Camino Real
- 641 Alvarado Rd
- 1488 Alvarado Rd
- 2935 Florence St
- 360 Alcatraz Ave
- 6446 Colby St
- 2601 College Ave Unit 203
- 2601 College Ave Unit 208
- 0 Gravatt Dr Unit 41122154
- 2 Gravatt Dr
- 2917 Telegraph Ave
- 260 Alvarado Rd
- 6100 Chabot Rd
- 0 Tunnel Rd
Your Personal Tour Guide
Ask me questions while you tour the home.