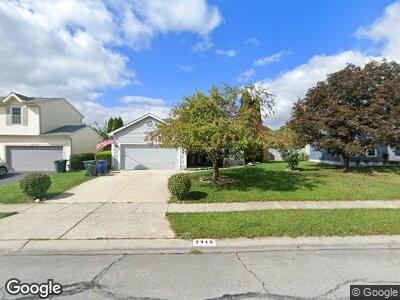
2945 Carlsbad Dr Hilliard, OH 43026
Cross Creek NeighborhoodEstimated Value: $323,444 - $341,000
3
Beds
2
Baths
1,345
Sq Ft
$246/Sq Ft
Est. Value
About This Home
This home is located at 2945 Carlsbad Dr, Hilliard, OH 43026 and is currently estimated at $331,361, approximately $246 per square foot. 2945 Carlsbad Dr is a home located in Franklin County with nearby schools including Hilliard Crossing Elementary School, Hilliard Station Sixth Grade Elementary School, and Hilliard Heritage Middle School.
Ownership History
Date
Name
Owned For
Owner Type
Purchase Details
Closed on
Oct 15, 2020
Sold by
Gull Misty L and Gull Matthew Misty
Bought by
Gil Ulises Gabriel Machado and Araque Iriana Carolina Molina
Current Estimated Value
Home Financials for this Owner
Home Financials are based on the most recent Mortgage that was taken out on this home.
Original Mortgage
$230,743
Outstanding Balance
$207,194
Interest Rate
2.8%
Mortgage Type
FHA
Estimated Equity
$124,167
Purchase Details
Closed on
Apr 30, 2001
Sold by
Copley Kenneth E and Copley Catherine M
Bought by
Gull Misty L
Home Financials for this Owner
Home Financials are based on the most recent Mortgage that was taken out on this home.
Original Mortgage
$134,000
Interest Rate
6.95%
Mortgage Type
VA
Purchase Details
Closed on
Oct 11, 1994
Sold by
Viveiros Ernest
Bought by
Copley Kenneth E and Copley Catherine M
Purchase Details
Closed on
Nov 18, 1991
Create a Home Valuation Report for This Property
The Home Valuation Report is an in-depth analysis detailing your home's value as well as a comparison with similar homes in the area
Home Values in the Area
Average Home Value in this Area
Purchase History
| Date | Buyer | Sale Price | Title Company |
|---|---|---|---|
| Gil Ulises Gabriel Machado | $235,000 | Search 2 Close | |
| Gull Misty L | $134,000 | -- | |
| Copley Kenneth E | $104,500 | -- | |
| -- | $86,400 | -- |
Source: Public Records
Mortgage History
| Date | Status | Borrower | Loan Amount |
|---|---|---|---|
| Open | Gil Ulises Gabriel Machado | $230,743 | |
| Previous Owner | Matthews Misty L | $149,900 | |
| Previous Owner | Matthews Misty L | $108,088 | |
| Previous Owner | Matthews Misty L | $9,000 | |
| Previous Owner | Gull Misty L | $134,000 | |
| Previous Owner | Copley Kenneth E | $24,000 |
Source: Public Records
Tax History Compared to Growth
Tax History
| Year | Tax Paid | Tax Assessment Tax Assessment Total Assessment is a certain percentage of the fair market value that is determined by local assessors to be the total taxable value of land and additions on the property. | Land | Improvement |
|---|---|---|---|---|
| 2024 | $5,187 | $91,840 | $29,470 | $62,370 |
| 2023 | $4,494 | $91,840 | $29,470 | $62,370 |
| 2022 | $4,134 | $67,660 | $15,370 | $52,290 |
| 2021 | $4,130 | $67,660 | $15,370 | $52,290 |
| 2020 | $4,080 | $67,030 | $15,370 | $51,660 |
| 2019 | $3,845 | $53,940 | $12,290 | $41,650 |
| 2018 | $3,855 | $53,940 | $12,290 | $41,650 |
| 2017 | $3,829 | $53,940 | $12,290 | $41,650 |
| 2016 | $4,046 | $52,790 | $11,800 | $40,990 |
| 2015 | $3,882 | $52,790 | $11,800 | $40,990 |
| 2014 | $3,799 | $52,790 | $11,800 | $40,990 |
| 2013 | $1,833 | $50,260 | $11,235 | $39,025 |
Source: Public Records
Map
Nearby Homes
- 3021 Seeger St Unit 97
- 4936 Silver Bow Dr
- 2892 Castlebrook Ave
- 4939 Stoneybrook Blvd Unit 18f
- 4969 Hidden View Ct
- 5133 Hidden View Dr
- 2505 Roberts Ct
- 2738 Westbreeze Dr
- 5255 Springdale Blvd
- 2994 Tempe Ct
- 5083 Renmill Dr
- 5135 Bonner Dr
- 5297 Old Creek Ln
- 5199 Goldfield Dr
- 3094 Hyde Park Ct
- 5350 Whispering Oak Blvd
- 3098 Stouenburgh Dr
- 3124 Serpentine Dr
- 5037 Langcroft Dr
- 5017 Crestbury Ct
- 2945 Carlsbad Dr
- 2937 Carlsbad Dr
- 2953 Carlsbad Dr
- 2944 Culver Dr
- 2961 Carlsbad Dr
- 2936 Culver Dr
- 2952 Culver Dr
- 2929 Carlsbad Dr
- 2946 Carlsbad Dr
- 2928 Culver Dr
- 2960 Culver Dr
- 2969 Carlsbad Dr
- 2954 Carlsbad Dr
- 2930 Carlsbad Dr
- 2968 Culver Dr
- 2962 Carlsbad Dr
- 2922 Carlsbad Dr
- 2977 Carlsbad Dr
- 2970 Carlsbad Dr
- 2935 Culver Dr