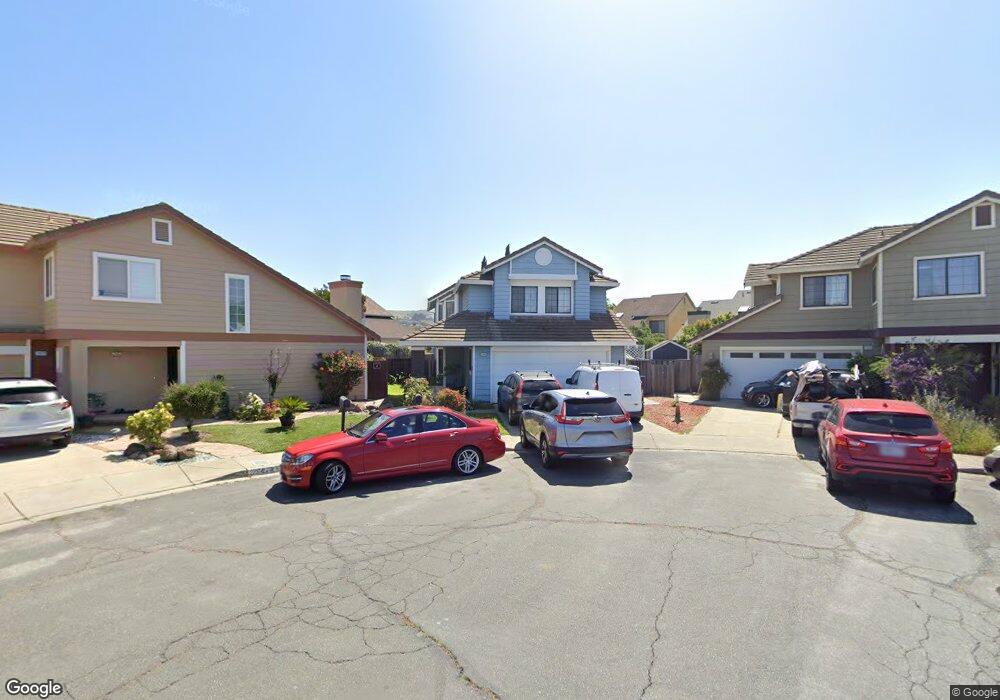
29480 Sal Ct Hayward, CA 94544
Tennyson-Alquire NeighborhoodEstimated Value: $987,612 - $1,156,000
4
Beds
3
Baths
1,878
Sq Ft
$572/Sq Ft
Est. Value
About This Home
This home is located at 29480 Sal Ct, Hayward, CA 94544 and is currently estimated at $1,073,903, approximately $571 per square foot. 29480 Sal Ct is a home located in Alameda County with nearby schools including Cesar Chavez Middle School, Tennyson High School, and St. Bede Catholic School.
Ownership History
Date
Name
Owned For
Owner Type
Purchase Details
Closed on
Jul 14, 1998
Sold by
Duncan Alan
Bought by
Farook Mohamed and Farook Farida B
Current Estimated Value
Purchase Details
Closed on
Aug 18, 1997
Sold by
Duncan Alan
Bought by
Duncan Alan
Home Financials for this Owner
Home Financials are based on the most recent Mortgage that was taken out on this home.
Original Mortgage
$23,600
Interest Rate
7.45%
Create a Home Valuation Report for This Property
The Home Valuation Report is an in-depth analysis detailing your home's value as well as a comparison with similar homes in the area
Home Values in the Area
Average Home Value in this Area
Purchase History
| Date | Buyer | Sale Price | Title Company |
|---|---|---|---|
| Farook Mohamed | $295,000 | Chicago Title Co | |
| Duncan Alan | -- | -- |
Source: Public Records
Mortgage History
| Date | Status | Borrower | Loan Amount |
|---|---|---|---|
| Previous Owner | Duncan Alan | $23,600 |
Source: Public Records
Tax History
| Year | Tax Paid | Tax Assessment Tax Assessment Total Assessment is a certain percentage of the fair market value that is determined by local assessors to be the total taxable value of land and additions on the property. | Land | Improvement |
|---|---|---|---|---|
| 2025 | $5,747 | $462,447 | $137,950 | $324,497 |
| 2024 | $5,747 | $453,382 | $135,246 | $318,136 |
| 2023 | $5,662 | $444,493 | $132,594 | $311,899 |
| 2022 | $5,554 | $435,779 | $129,995 | $305,784 |
| 2021 | $5,509 | $427,235 | $127,446 | $299,789 |
| 2020 | $5,449 | $422,855 | $126,140 | $296,715 |
| 2019 | $5,493 | $414,566 | $123,667 | $290,899 |
| 2018 | $5,159 | $406,438 | $121,242 | $285,196 |
| 2017 | $5,042 | $398,471 | $118,866 | $279,605 |
| 2016 | $4,752 | $390,658 | $116,535 | $274,123 |
| 2015 | $4,658 | $384,791 | $114,785 | $270,006 |
| 2014 | $4,426 | $377,254 | $112,537 | $264,717 |
Source: Public Records
Map
Nearby Homes
- 234 Bolt Ct
- 242 Bolt Ct
- 260 Industrial Pkwy Unit 47
- 29255 Harpoon Way
- 29131 Delgado Rd
- 29133 De la Cruz Rd
- 29273 Nantucket Way
- 29026 Hillview St
- 29181 Dixon St
- 29300 Dixon St Unit 207
- 29300 Dixon St Unit 106
- 933 New England Village Dr
- 405 Industrial Pkwy
- 139 Mars Ave Unit 139
- 29330 Middleborough Way
- 218 Valle Vista Ave
- 29372 Providence Way Unit 111
- 29424 Providence Way
- 29621 Red Oak Ct Unit 6
- 29428 Middleborough Way
- 29474 Sal Ct
- 29486 Sal Ct
- 29589 Chance St
- 29575 Chance St
- 127 Mediterranean Ave
- 115 Mediterranean Ave
- 139 Mediterranean Ave
- 29561 Chance St
- 29468 Sal Ct
- 151 Mediterranean Ave
- 103 Mediterranean Ave
- 29547 Chance St
- 163 Mediterranean Ave
- 29479 Sal Ct
- 29462 Sal Ct
- 29473 Sal Ct
- 29533 Chance St
- 175 Mediterranean Ave
- 29467 Sal Ct
- 29456 Sal Ct
Your Personal Tour Guide
Ask me questions while you tour the home.