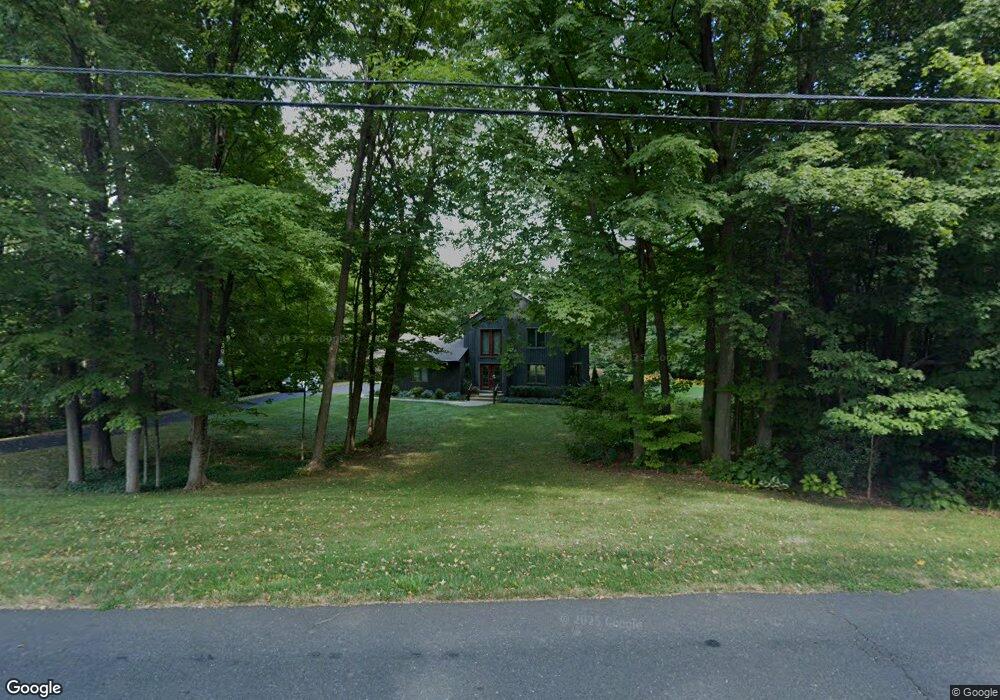
295 Abbe Rd Enfield, CT 06082
Estimated Value: $434,000 - $464,816
3
Beds
3
Baths
1,756
Sq Ft
$252/Sq Ft
Est. Value
About This Home
This home is located at 295 Abbe Rd, Enfield, CT 06082 and is currently estimated at $442,454, approximately $251 per square foot. 295 Abbe Rd is a home located in Hartford County with nearby schools including Edgar H. Parkman School, Nathan Hale Elementary School, and Enfield High School.
Ownership History
Date
Name
Owned For
Owner Type
Purchase Details
Closed on
Dec 15, 2005
Sold by
Mckeen Steven and Mckeen Cathy
Bought by
Lamondia James and Lamondia Bonnie
Current Estimated Value
Home Financials for this Owner
Home Financials are based on the most recent Mortgage that was taken out on this home.
Original Mortgage
$170,000
Interest Rate
6.34%
Purchase Details
Closed on
Jul 26, 1988
Sold by
Letourneau Denis
Bought by
Mckeen Steven
Create a Home Valuation Report for This Property
The Home Valuation Report is an in-depth analysis detailing your home's value as well as a comparison with similar homes in the area
Home Values in the Area
Average Home Value in this Area
Purchase History
| Date | Buyer | Sale Price | Title Company |
|---|---|---|---|
| Lamondia James | $415,000 | -- | |
| Mckeen Steven | $237,500 | -- |
Source: Public Records
Mortgage History
| Date | Status | Borrower | Loan Amount |
|---|---|---|---|
| Closed | Mckeen Steven | $100,000 | |
| Closed | Mckeen Steven | $155,000 | |
| Closed | Mckeen Steven | $170,000 |
Source: Public Records
Tax History
| Year | Tax Paid | Tax Assessment Tax Assessment Total Assessment is a certain percentage of the fair market value that is determined by local assessors to be the total taxable value of land and additions on the property. | Land | Improvement |
|---|---|---|---|---|
| 2025 | $8,317 | $237,700 | $66,700 | $171,000 |
| 2024 | $8,094 | $237,700 | $66,700 | $171,000 |
| 2023 | $8,034 | $237,700 | $66,700 | $171,000 |
| 2022 | $7,295 | $237,700 | $66,700 | $171,000 |
| 2021 | $7,676 | $204,540 | $57,580 | $146,960 |
| 2020 | $7,676 | $204,540 | $57,580 | $146,960 |
| 2019 | $7,697 | $204,540 | $57,580 | $146,960 |
| 2018 | $7,568 | $204,540 | $57,580 | $146,960 |
| 2017 | $6,876 | $196,840 | $57,580 | $139,260 |
| 2016 | $6,654 | $193,930 | $57,580 | $136,350 |
| 2015 | $6,396 | $192,430 | $57,580 | $134,850 |
| 2014 | $6,231 | $192,430 | $57,580 | $134,850 |
Source: Public Records
Map
Nearby Homes
Your Personal Tour Guide
Ask me questions while you tour the home.