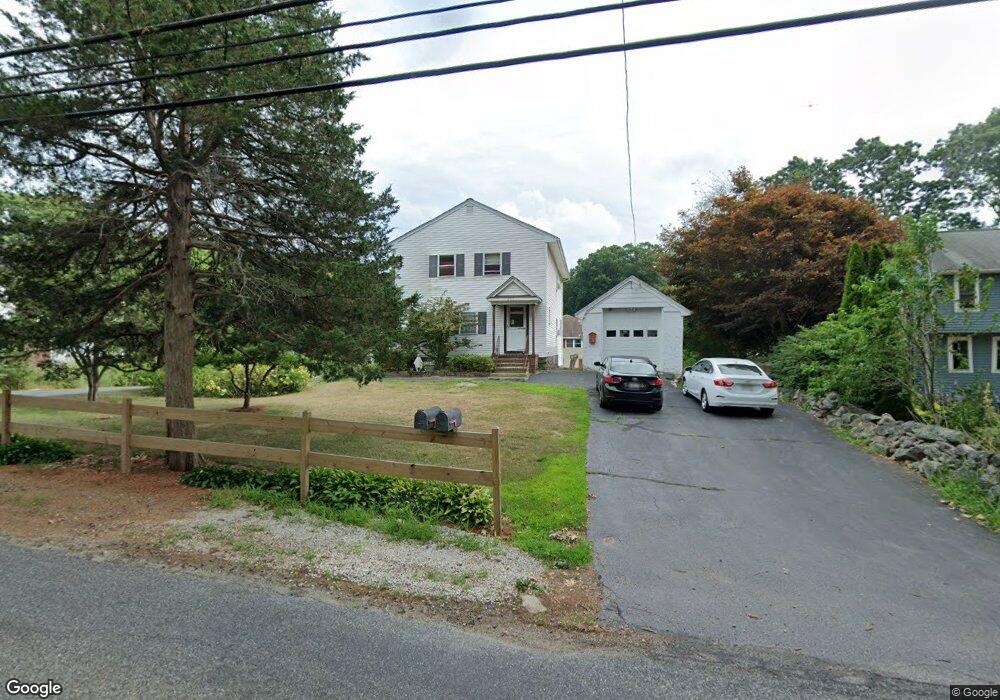
295 Central St Milford, MA 01757
Estimated Value: $809,000 - $998,083
3
Beds
2
Baths
1,792
Sq Ft
$516/Sq Ft
Est. Value
About This Home
This home is located at 295 Central St, Milford, MA 01757 and is currently estimated at $925,028, approximately $516 per square foot. 295 Central St is a home located in Worcester County with nearby schools including Milford High School and Bethany Christian Academy.
Ownership History
Date
Name
Owned For
Owner Type
Purchase Details
Closed on
Jan 9, 2014
Sold by
Taddei Joseph V
Bought by
101 Central Street Rt
Current Estimated Value
Purchase Details
Closed on
Apr 15, 2005
Sold by
Taddei Charlotte M and Taddei John A
Bought by
Taddei Charlotte M and Taddei John A
Purchase Details
Closed on
Feb 7, 1972
Bought by
Taddei John A and Taddei Charlotte M
Create a Home Valuation Report for This Property
The Home Valuation Report is an in-depth analysis detailing your home's value as well as a comparison with similar homes in the area
Home Values in the Area
Average Home Value in this Area
Purchase History
| Date | Buyer | Sale Price | Title Company |
|---|---|---|---|
| 101 Central Street Rt | -- | -- | |
| Taddei Charlotte M | -- | -- | |
| Taddei John A | -- | -- |
Source: Public Records
Mortgage History
| Date | Status | Borrower | Loan Amount |
|---|---|---|---|
| Previous Owner | Taddei John A | $32,180 | |
| Previous Owner | Taddei John A | $32,189 |
Source: Public Records
Tax History Compared to Growth
Tax History
| Year | Tax Paid | Tax Assessment Tax Assessment Total Assessment is a certain percentage of the fair market value that is determined by local assessors to be the total taxable value of land and additions on the property. | Land | Improvement |
|---|---|---|---|---|
| 2025 | $11,704 | $914,400 | $271,700 | $642,700 |
| 2024 | $11,360 | $854,800 | $263,000 | $591,800 |
| 2023 | $10,739 | $743,200 | $231,700 | $511,500 |
| 2022 | $10,331 | $671,300 | $216,400 | $454,900 |
| 2021 | $9,933 | $621,600 | $216,400 | $405,200 |
| 2020 | $9,736 | $610,000 | $216,400 | $393,600 |
| 2019 | $9,042 | $546,700 | $216,400 | $330,300 |
| 2018 | $301 | $516,300 | $212,100 | $304,200 |
| 2017 | $8,306 | $494,700 | $212,100 | $282,600 |
| 2016 | $8,183 | $476,300 | $212,100 | $264,200 |
| 2015 | $7,969 | $454,100 | $203,400 | $250,700 |
Source: Public Records
Map
Nearby Homes
- 9 Hillside Ave
- 3 S Central St
- 97 E Street Extension
- 35 Woodland Ave Unit 35A
- 23 Christina Rd
- 57 Beach St
- 10 Black Bear Unit 10
- 11 Black Bear Unit 11
- 9 Black Bear Cir Unit 9
- 7 Black Bear Unit 7
- 3 Black Bear Cir Unit 3
- 43 Black Bear Cir Unit 43
- 48 Black Bear Cir Unit 48
- 55 Jefferson St
- 17 Middleton St
- 102-104 Central St
- 56 S Bow St
- 30 Whitney St
- 48 Claflin St
- 29 Forest St
- 295 Central St Unit 2
- 293 Central St
- 293 Central St
- 6 Frank Dr
- 299 Central St
- 8 Frank Dr
- 291 Central St
- 4 Frank Dr
- 301 Central St
- 292 Central St
- 289 Central St
- 7 Frank Dr
- 5 Frank Dr
- 101 Mount Pleasant St
- 296 Central St
- 287 Central St
- 4 Moschilli Cir
- 1 Moschilli Cir
- 99 Mount Pleasant St
- 11 Bear Hill Rd