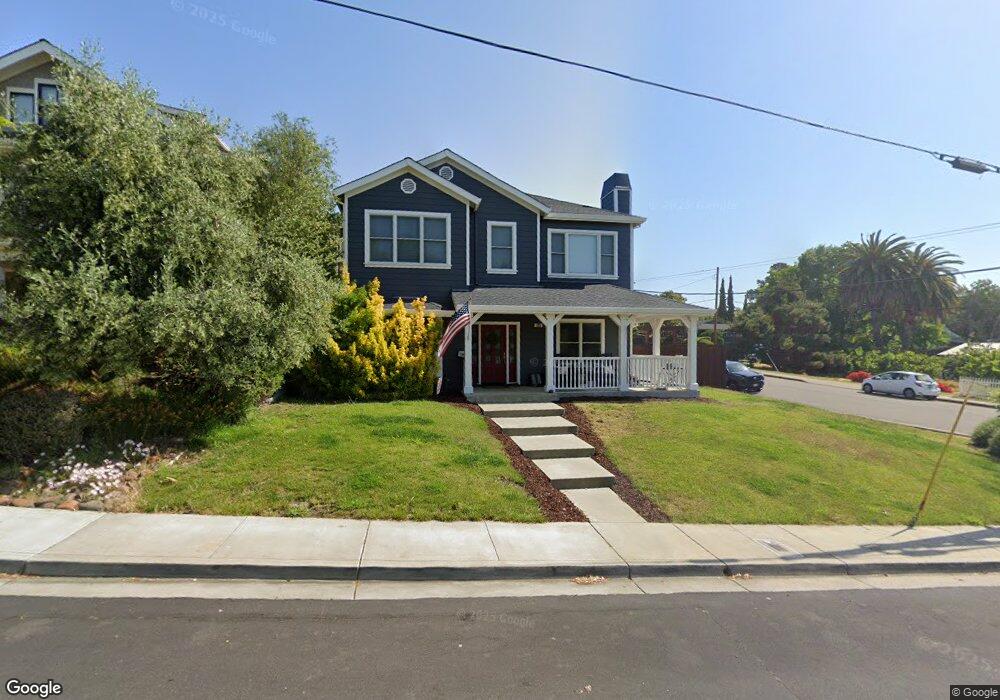
295 E I St Benicia, CA 94510
Estimated Value: $985,000 - $1,084,000
4
Beds
3
Baths
2,530
Sq Ft
$406/Sq Ft
Est. Value
About This Home
This home is located at 295 E I St, Benicia, CA 94510 and is currently estimated at $1,028,188, approximately $406 per square foot. 295 E I St is a home located in Solano County with nearby schools including Mary Farmar Elementary School, Benicia Middle School, and Benicia High School.
Ownership History
Date
Name
Owned For
Owner Type
Purchase Details
Closed on
Sep 10, 2019
Sold by
Green Valley Partners Inc
Bought by
French Brian and French Jaina
Current Estimated Value
Home Financials for this Owner
Home Financials are based on the most recent Mortgage that was taken out on this home.
Original Mortgage
$484,300
Outstanding Balance
$425,076
Interest Rate
3.7%
Mortgage Type
New Conventional
Estimated Equity
$603,112
Purchase Details
Closed on
Jul 20, 2010
Sold by
French Gary
Bought by
Green Valley Partners Inc
Purchase Details
Closed on
Apr 6, 2007
Sold by
Pauline Jason C
Bought by
French Gary
Purchase Details
Closed on
Mar 14, 2006
Sold by
Benicia Holding Inc
Bought by
Pauline Jason C
Create a Home Valuation Report for This Property
The Home Valuation Report is an in-depth analysis detailing your home's value as well as a comparison with similar homes in the area
Home Values in the Area
Average Home Value in this Area
Purchase History
| Date | Buyer | Sale Price | Title Company |
|---|---|---|---|
| French Brian | $725,000 | Placer Title Company | |
| Green Valley Partners Inc | $275,000 | None Available | |
| French Gary | $550,000 | North American Title Co | |
| Pauline Jason C | -- | North American Title Co | |
| Pauline Jason C | $615,000 | Frontier Title Company |
Source: Public Records
Mortgage History
| Date | Status | Borrower | Loan Amount |
|---|---|---|---|
| Open | French Brian | $484,300 |
Source: Public Records
Tax History
| Year | Tax Paid | Tax Assessment Tax Assessment Total Assessment is a certain percentage of the fair market value that is determined by local assessors to be the total taxable value of land and additions on the property. | Land | Improvement |
|---|---|---|---|---|
| 2025 | $9,291 | $792,888 | $229,663 | $563,225 |
| 2024 | $9,291 | $777,342 | $225,160 | $552,182 |
| 2023 | $9,068 | $762,101 | $220,746 | $541,355 |
| 2022 | $8,899 | $747,159 | $216,418 | $530,741 |
| 2021 | $8,718 | $732,510 | $212,175 | $520,335 |
| 2020 | $8,602 | $725,000 | $210,000 | $515,000 |
| 2019 | $6,832 | $574,246 | $114,847 | $459,399 |
| 2018 | $6,657 | $562,988 | $112,596 | $450,392 |
| 2017 | $6,503 | $551,950 | $110,389 | $441,561 |
| 2016 | $6,560 | $541,128 | $108,225 | $432,903 |
| 2015 | $6,394 | $533,001 | $106,600 | $426,401 |
| 2014 | $6,319 | $522,561 | $104,512 | $418,049 |
Source: Public Records
Map
Nearby Homes
Your Personal Tour Guide
Ask me questions while you tour the home.