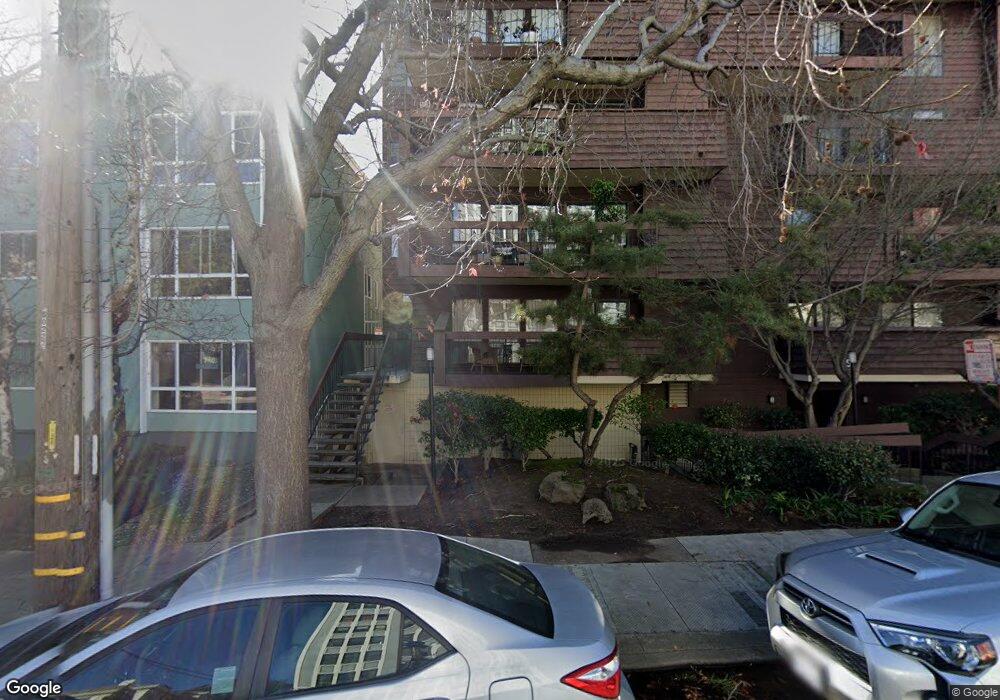
295 Lenox Ave Unit 301 Oakland, CA 94610
Adams Point NeighborhoodEstimated Value: $610,000 - $883,000
3
Beds
2
Baths
1,613
Sq Ft
$458/Sq Ft
Est. Value
About This Home
This home is located at 295 Lenox Ave Unit 301, Oakland, CA 94610 and is currently estimated at $738,603, approximately $457 per square foot. 295 Lenox Ave Unit 301 is a home located in Alameda County with nearby schools including Lincoln Elementary School, Westlake Middle School, and Oakland Technical High School.
Ownership History
Date
Name
Owned For
Owner Type
Purchase Details
Closed on
Oct 4, 2017
Sold by
Dickman Michael Lee and Rydstrom Todd Lee
Bought by
Dickman Michael Lee and Rydstrom Todd Lee
Current Estimated Value
Purchase Details
Closed on
May 22, 1998
Sold by
Buchanan Denise
Bought by
Dickman Michael L and Rydstrom Todd L
Home Financials for this Owner
Home Financials are based on the most recent Mortgage that was taken out on this home.
Original Mortgage
$133,600
Outstanding Balance
$26,173
Interest Rate
7.13%
Mortgage Type
Purchase Money Mortgage
Estimated Equity
$712,430
Purchase Details
Closed on
Dec 4, 1995
Sold by
Kaplan George Cameron
Bought by
Buchanan Denise
Home Financials for this Owner
Home Financials are based on the most recent Mortgage that was taken out on this home.
Original Mortgage
$156,550
Interest Rate
7.47%
Mortgage Type
Purchase Money Mortgage
Create a Home Valuation Report for This Property
The Home Valuation Report is an in-depth analysis detailing your home's value as well as a comparison with similar homes in the area
Home Values in the Area
Average Home Value in this Area
Purchase History
| Date | Buyer | Sale Price | Title Company |
|---|---|---|---|
| Dickman Michael Lee | -- | None Available | |
| Dickman Michael L | $167,000 | Chicago Title Co | |
| Buchanan Denise | $165,000 | Chicago Title Co |
Source: Public Records
Mortgage History
| Date | Status | Borrower | Loan Amount |
|---|---|---|---|
| Open | Dickman Michael L | $133,600 | |
| Previous Owner | Buchanan Denise | $156,550 | |
| Closed | Dickman Michael L | $16,700 |
Source: Public Records
Tax History Compared to Growth
Tax History
| Year | Tax Paid | Tax Assessment Tax Assessment Total Assessment is a certain percentage of the fair market value that is determined by local assessors to be the total taxable value of land and additions on the property. | Land | Improvement |
|---|---|---|---|---|
| 2025 | $5,001 | $259,643 | $79,993 | $186,650 |
| 2024 | $5,001 | $254,416 | $78,425 | $182,991 |
| 2023 | $5,164 | $256,291 | $76,887 | $179,404 |
| 2022 | $4,977 | $244,265 | $75,379 | $175,886 |
| 2021 | $4,651 | $239,340 | $73,902 | $172,438 |
| 2020 | $4,597 | $243,814 | $73,144 | $170,670 |
| 2019 | $4,356 | $239,034 | $71,710 | $167,324 |
| 2018 | $4,266 | $234,348 | $70,304 | $164,044 |
| 2017 | $4,075 | $229,754 | $68,926 | $160,828 |
| 2016 | $3,875 | $225,250 | $67,575 | $157,675 |
| 2015 | $3,851 | $221,867 | $66,560 | $155,307 |
| 2014 | $3,819 | $217,521 | $65,256 | $152,265 |
Source: Public Records
Map
Nearby Homes
- 325 Lenox Ave Unit 104
- 193 Montecito Ave Unit 303
- 58 Vernon St Unit 201
- 320 Lee St Unit 202
- 320 Lee St Unit 201
- 85 Vernon St Unit 315
- 85 Vernon St Unit 208
- 321 Warwick Ave Unit 302
- 383 Staten Ave Unit 201
- 245 Perkins St Unit 33
- 2338 Waverly St
- 254 Perkins St
- 350 Adams St
- 375 Jayne Ave Unit 106
- 375 Jayne Ave Unit 402
- 565 Bellevue Ave Unit 1708
- 565 Bellevue Ave Unit 806C
- 55 Fairmount Ave Unit 215
- 233 Orange St Unit 304
- 66 Fairmount Ave Unit 316
- 295 Lenox Ave Unit 303
- 295 Lenox Ave Unit 302
- 295 Lenox Ave Unit 206
- 295 Lenox Ave Unit 205
- 295 Lenox Ave Unit 204
- 295 Lenox Ave Unit 203
- 295 Lenox Ave Unit 202
- 295 Lenox Ave Unit 201
- 295 Lenox Ave Unit 106
- 295 Lenox Ave Unit 105
- 295 Lenox Ave Unit 104
- 295 Lenox Ave Unit 103
- 295 Lenox Ave Unit 102
- 295 Lenox Ave Unit 101
- 295 Lenox Ave Unit 406
- 295 Lenox Ave Unit 405
- 295 Lenox Ave Unit 404
- 295 Lenox Ave Unit 403
- 295 Lenox Ave Unit 402
- 295 Lenox Ave Unit 401