2950 Dove St Redding, CA 96001
Parkview NeighborhoodEstimated Value: $300,000 - $374,000
3
Beds
2
Baths
1,602
Sq Ft
$210/Sq Ft
Est. Value
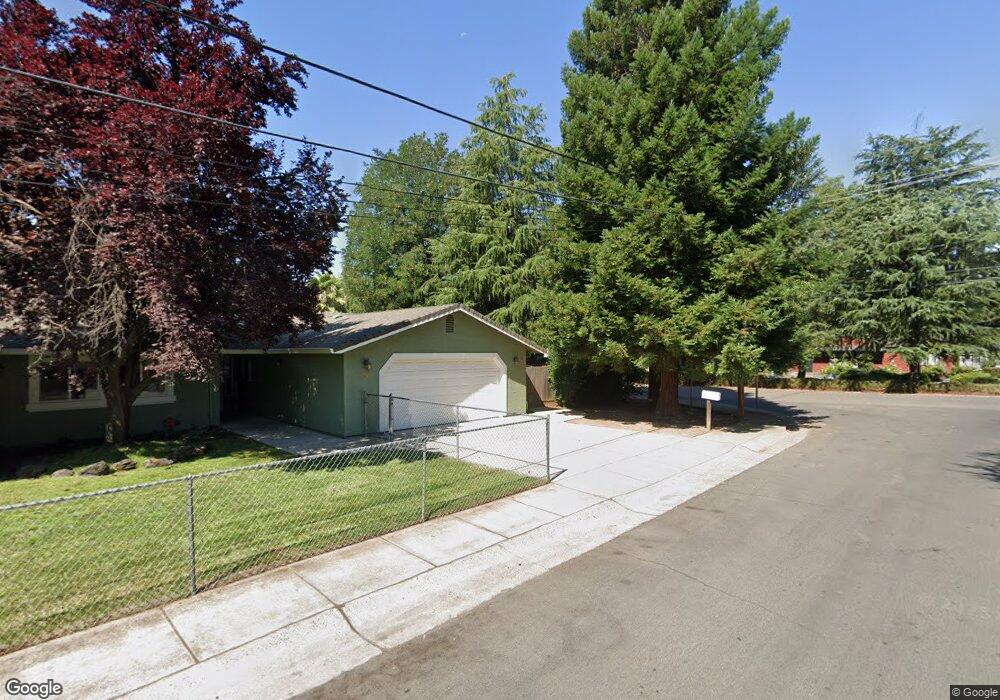
About This Home
This home is located at 2950 Dove St, Redding, CA 96001 and is currently estimated at $337,216, approximately $210 per square foot. 2950 Dove St is a home located in Shasta County with nearby schools including Juniper, Sequoia Middle School, and Shasta High School.
Ownership History
Date
Name
Owned For
Owner Type
Purchase Details
Closed on
Oct 10, 2025
Sold by
Bell Suann L and Lawrence Keith W
Bought by
Bell Suann L
Current Estimated Value
Home Financials for this Owner
Home Financials are based on the most recent Mortgage that was taken out on this home.
Original Mortgage
$277,574
Outstanding Balance
$277,311
Interest Rate
6.26%
Mortgage Type
FHA
Estimated Equity
$59,905
Purchase Details
Closed on
Oct 23, 2020
Sold by
Bell Suann L
Bought by
Bell Suann L and Lawrence Keith W
Home Financials for this Owner
Home Financials are based on the most recent Mortgage that was taken out on this home.
Original Mortgage
$232,000
Interest Rate
2.8%
Mortgage Type
New Conventional
Purchase Details
Closed on
May 25, 2005
Sold by
Bell Sharon
Bought by
Bell Suann L
Purchase Details
Closed on
Nov 7, 2002
Sold by
Lasley Mabelle
Bought by
Lasley Mabelle
Purchase Details
Closed on
Nov 27, 2001
Sold by
Mccollum Ivan V and Mccollum Irene L
Bought by
Lasley Mabelle
Home Financials for this Owner
Home Financials are based on the most recent Mortgage that was taken out on this home.
Original Mortgage
$61,000
Interest Rate
6.63%
Mortgage Type
Purchase Money Mortgage
Create a Home Valuation Report for This Property
The Home Valuation Report is an in-depth analysis detailing your home's value as well as a comparison with similar homes in the area
Home Values in the Area
Average Home Value in this Area
Purchase History
| Date | Buyer | Sale Price | Title Company |
|---|---|---|---|
| Bell Suann L | -- | Vylla Title | |
| Bell Suann L | -- | First American Title Company | |
| Bell Suann L | -- | -- | |
| Bell Suann L | -- | -- | |
| Bell Sharon | -- | -- | |
| Lasley Mabelle | -- | -- | |
| Lasley Mabelle | $62,500 | Fidelity National Title Co |
Source: Public Records
Mortgage History
| Date | Status | Borrower | Loan Amount |
|---|---|---|---|
| Open | Bell Suann L | $277,574 | |
| Previous Owner | Bell Suann L | $232,000 | |
| Previous Owner | Lasley Mabelle | $61,000 |
Source: Public Records
Tax History
| Year | Tax Paid | Tax Assessment Tax Assessment Total Assessment is a certain percentage of the fair market value that is determined by local assessors to be the total taxable value of land and additions on the property. | Land | Improvement |
|---|---|---|---|---|
| 2025 | $2,762 | $273,271 | $63,547 | $209,724 |
| 2024 | $2,718 | $267,913 | $62,301 | $205,612 |
| 2023 | $2,718 | $262,661 | $61,080 | $201,581 |
| 2022 | $2,671 | $257,512 | $59,883 | $197,629 |
| 2021 | $2,657 | $252,463 | $58,709 | $193,754 |
| 2020 | $2,365 | $220,000 | $45,000 | $175,000 |
| 2019 | $2,236 | $215,000 | $45,000 | $170,000 |
| 2018 | $2,192 | $205,000 | $45,000 | $160,000 |
| 2017 | $2,168 | $200,000 | $45,000 | $155,000 |
| 2016 | $1,922 | $180,000 | $45,000 | $135,000 |
| 2015 | $1,871 | $175,000 | $45,000 | $130,000 |
| 2014 | $1,895 | $175,000 | $45,000 | $130,000 |
Source: Public Records
Map
Nearby Homes
- 351 Weldon St
- 2845 River Mist Walk
- 2857 River Mist Walk
- 2865 River Mist Walk
- 2590 Henderson Rd
- 864 Kite Ln
- 2630 Wyndham Ln
- 3425 Riverview Dr
- 745 Parkview Ave
- 3081 Henderson Rd
- 3244 Veda St
- 3829 Thea Dr
- 2935 Shotwick Trail
- 3817 Thea Dr
- 3660-3671 Technology Way
- 1012 State St
- 3443 West St
- 0000 Wyndham Pointe Subdivision
- 2514 California St
- 2405 Cliff Dr
Your Personal Tour Guide
Ask me questions while you tour the home.