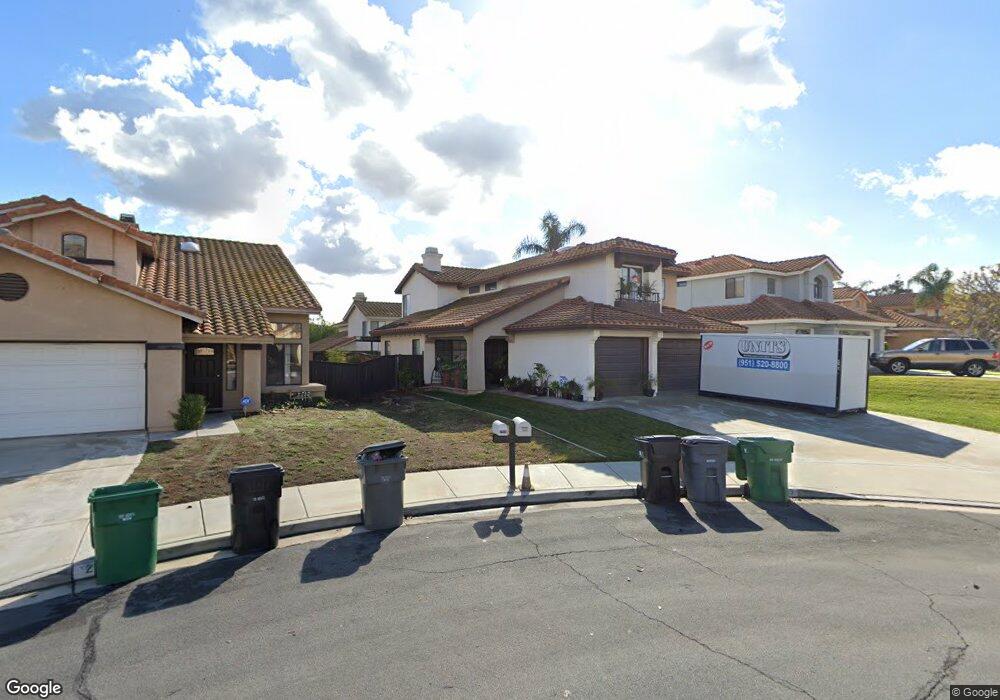
2950 Hampshire Cir Corona, CA 92879
Corona Ranch NeighborhoodEstimated Value: $754,539 - $830,000
4
Beds
3
Baths
2,180
Sq Ft
$365/Sq Ft
Est. Value
About This Home
This home is located at 2950 Hampshire Cir, Corona, CA 92879 and is currently estimated at $796,635, approximately $365 per square foot. 2950 Hampshire Cir is a home located in Riverside County with nearby schools including Promenade Elementary School, Ysmael Villegas Middle School, and Hillcrest High School.
Ownership History
Date
Name
Owned For
Owner Type
Purchase Details
Closed on
Jun 20, 2017
Sold by
Valdez Patrick Vintayen and Valdez Colleen Pillarina
Bought by
Valdez Patrick Vintayen and Valdez Colleen Abigail Pillarina
Current Estimated Value
Home Financials for this Owner
Home Financials are based on the most recent Mortgage that was taken out on this home.
Original Mortgage
$352,000
Outstanding Balance
$293,031
Interest Rate
4.05%
Mortgage Type
New Conventional
Estimated Equity
$503,604
Purchase Details
Closed on
Jun 14, 2017
Sold by
Valdez Marlon R and Valdez Precilla V
Bought by
Valdez Patrick Vintayen and Valdez Colleen Pillarina
Home Financials for this Owner
Home Financials are based on the most recent Mortgage that was taken out on this home.
Original Mortgage
$352,000
Outstanding Balance
$293,031
Interest Rate
4.05%
Mortgage Type
New Conventional
Estimated Equity
$503,604
Create a Home Valuation Report for This Property
The Home Valuation Report is an in-depth analysis detailing your home's value as well as a comparison with similar homes in the area
Home Values in the Area
Average Home Value in this Area
Purchase History
| Date | Buyer | Sale Price | Title Company |
|---|---|---|---|
| Valdez Patrick Vintayen | -- | Servicelink Crs | |
| Valdez Patrick Vintayen | $440,000 | Servicelink Crs |
Source: Public Records
Mortgage History
| Date | Status | Borrower | Loan Amount |
|---|---|---|---|
| Open | Valdez Patrick Vintayen | $352,000 |
Source: Public Records
Tax History Compared to Growth
Tax History
| Year | Tax Paid | Tax Assessment Tax Assessment Total Assessment is a certain percentage of the fair market value that is determined by local assessors to be the total taxable value of land and additions on the property. | Land | Improvement |
|---|---|---|---|---|
| 2025 | $4,632 | $378,035 | $119,564 | $258,471 |
| 2023 | $4,632 | $363,357 | $114,922 | $248,435 |
| 2022 | $4,277 | $356,233 | $112,669 | $243,564 |
| 2021 | $4,190 | $349,249 | $110,460 | $238,789 |
| 2020 | $4,123 | $345,669 | $109,328 | $236,341 |
| 2019 | $4,070 | $338,892 | $107,185 | $231,707 |
| 2018 | $4,013 | $332,248 | $105,085 | $227,163 |
| 2017 | $3,939 | $325,734 | $103,025 | $222,709 |
| 2016 | $3,874 | $319,348 | $101,005 | $218,343 |
| 2015 | $3,822 | $314,553 | $99,489 | $215,064 |
| 2014 | $3,812 | $308,393 | $97,541 | $210,852 |
Source: Public Records
Map
Nearby Homes
- 2981 Pembroke Cir
- 2925 Via Toscana Unit 202
- 4000 Pierce St Unit 197
- 4000 Pierce St Unit 267
- 4000 Pierce St Unit 282
- 4000 Pierce St Unit 284
- 4000 Pierce St Unit 132
- 4000 Pierce St Unit 220
- 4000 Pierce St Unit 279
- 12011 Quantico Dr
- 835 Baghdady St
- 3883 Buchanan St Unit 133
- 3883 Buchanan St Unit 88
- 3883 Buchanan St Unit 3
- 12221 Dewar Dr
- 2599 Pinnacle Cir
- 12179 Dewar Dr
- 4192 Bear Place
- 2622 Presidio Ln
- 12018 Dewar Dr
- 2948 Argyle Cir
- 2958 Hampshire Cir
- 2951 Manchester Cir
- 2940 Argyle Cir
- 2959 Manchester Cir
- 2964 Hampshire Cir
- 2949 Brunswick Cir
- 2941 Brunswick Cir
- 2965 Manchester Cir
- 2951 Hampshire Cir
- 2949 Argyle Cir
- 2932 Argyle Cir
- 2972 Hampshire Cir
- 2959 Hampshire Cir Unit C
- 2933 Brunswick Cir
- 2973 Manchester Cir
- 2941 Argyle Cir
- 2965 Hampshire Cir
- 2980 Hampshire Cir
- 2924 Argyle Cir