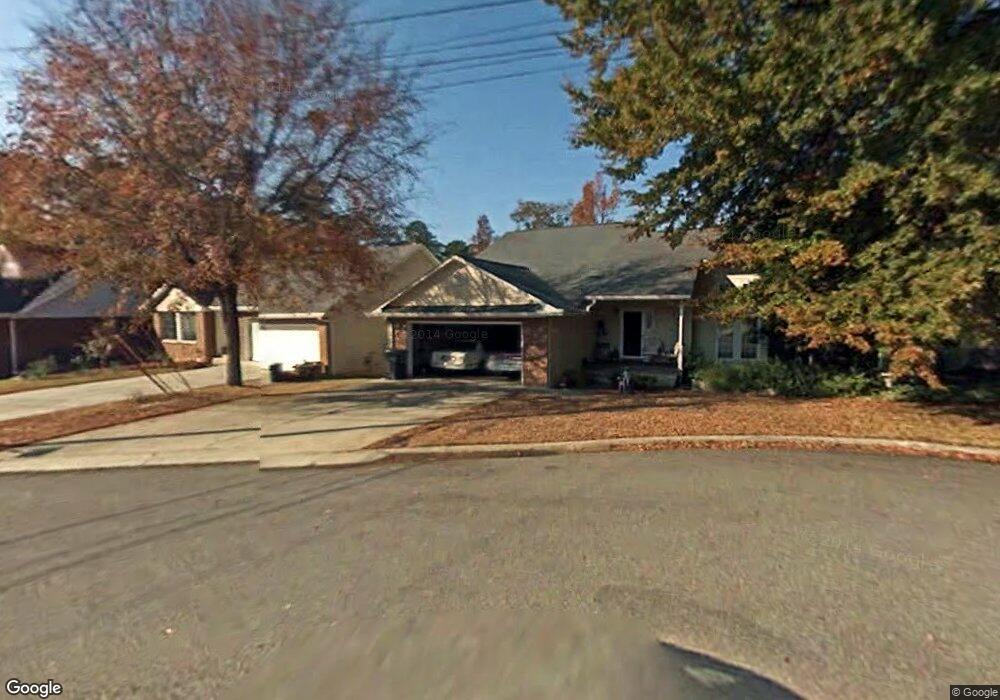
2951 Pointewest Dr Augusta, GA 30909
West Augusta NeighborhoodEstimated Value: $241,000 - $283,000
3
Beds
2
Baths
1,691
Sq Ft
$157/Sq Ft
Est. Value
About This Home
This home is located at 2951 Pointewest Dr, Augusta, GA 30909 and is currently estimated at $265,439, approximately $156 per square foot. 2951 Pointewest Dr is a home located in Richmond County with nearby schools including Tutt Middle School, Johnson Magnet, and Westside High School.
Ownership History
Date
Name
Owned For
Owner Type
Purchase Details
Closed on
Apr 1, 1992
Sold by
Tompkins J A
Bought by
Tobias Joseph M Tobias Emilie B
Current Estimated Value
Purchase Details
Closed on
Mar 30, 1992
Sold by
Tompkins J A
Bought by
Tobias Joseph M
Purchase Details
Closed on
Mar 24, 1992
Sold by
M-N Tompkins B and M-N Ente
Bought by
Tompkins J A
Purchase Details
Closed on
Nov 19, 1991
Sold by
Tompkins Benjamin J
Bought by
Tompkins J A
Purchase Details
Closed on
Aug 13, 1991
Sold by
Thompkins B J Sr M-N Enterprises M N
Bought by
Tompkins Ben J
Purchase Details
Closed on
Aug 1, 1991
Sold by
Thompkins B J
Bought by
Tompkins Ben J
Purchase Details
Closed on
Sep 11, 1990
Sold by
Westbrook Of Augusta Inc
Bought by
Thompkins B J Sr M-N Enterprises M N E
Purchase Details
Closed on
Sep 4, 1990
Sold by
Bankers First Fed S
Bought by
Thompkins B J
Purchase Details
Closed on
Aug 31, 1990
Sold by
Westbrook Of August
Bought by
Thompkins B J
Create a Home Valuation Report for This Property
The Home Valuation Report is an in-depth analysis detailing your home's value as well as a comparison with similar homes in the area
Home Values in the Area
Average Home Value in this Area
Purchase History
| Date | Buyer | Sale Price | Title Company |
|---|---|---|---|
| Tobias Joseph M Tobias Emilie B | -- | -- | |
| Tobias Joseph M | $89,900 | -- | |
| Tompkins J A | -- | -- | |
| Tompkins J A | -- | -- | |
| Tompkins Ben J | -- | -- | |
| Tompkins Ben J | -- | -- | |
| Thompkins B J Sr M-N Enterprises M N E | -- | -- | |
| Thompkins B J | -- | -- | |
| Thompkins B J | $39,000 | -- |
Source: Public Records
Tax History
| Year | Tax Paid | Tax Assessment Tax Assessment Total Assessment is a certain percentage of the fair market value that is determined by local assessors to be the total taxable value of land and additions on the property. | Land | Improvement |
|---|---|---|---|---|
| 2025 | $3,069 | $96,716 | $12,000 | $84,716 |
| 2024 | $3,069 | $81,192 | $12,000 | $69,192 |
| 2023 | $2,574 | $78,632 | $12,000 | $66,632 |
| 2022 | $2,774 | $84,923 | $12,000 | $72,923 |
| 2021 | $2,573 | $70,830 | $12,000 | $58,830 |
| 2020 | $2,531 | $70,830 | $12,000 | $58,830 |
| 2019 | $2,573 | $67,310 | $12,000 | $55,310 |
| 2018 | $2,428 | $67,310 | $12,000 | $55,310 |
| 2017 | $2,353 | $67,310 | $12,000 | $55,310 |
| 2016 | $2,355 | $67,310 | $12,000 | $55,310 |
| 2015 | $2,354 | $66,775 | $12,000 | $54,775 |
| 2014 | $2,357 | $66,775 | $12,000 | $54,775 |
Source: Public Records
Map
Nearby Homes
- 3007 Pointewest Dr
- 262 Lafayette Dr
- 2609 Sherborne Ct
- 2918 Arrowhead Dr
- 2330 Lions Gate Dr
- 2902 Sussex Rd
- 104 York Way
- 2006 Bromley Ct
- 2817 Brickrun Way
- 2908 Stratford Dr
- 2805 Brickrun Way
- 46 Charlestowne Dr
- 35 Charlestowne Dr
- 2703 Oakbluff Ct
- 2507 Pinebluff Ct
- 1208 Colony Place Dr
- 2705 Bolling Rd
- 1017 Stevens Creek Rd
- 1017 Stevens Creek Rd Unit G186
- 2531 Tupelo Dr
- 2953 Pointewest Dr
- 2953 Pointe Dr W
- 2949 Pointewest Dr
- 2955 Pointewest Dr
- 2922 Pointewest Dr
- 2922 Pointe Dr W
- 2947 Pointewest Dr
- 2847 Pineview Rd
- 2943 Pointewest Dr
- 2945 Pointewest Dr
- 2941 Pointewest Dr
- 2920 Pointewest Dr
- 2920 Pointe Dr W
- 2924 Pointewest Dr
- 2957 Pointewest Dr
- 2939 Pointewest Dr
- 2926 Pointewest Dr
- 2918 Pointewest Dr
- 2849 Pineview Rd
- 2937 Pointewest Dr
Your Personal Tour Guide
Ask me questions while you tour the home.