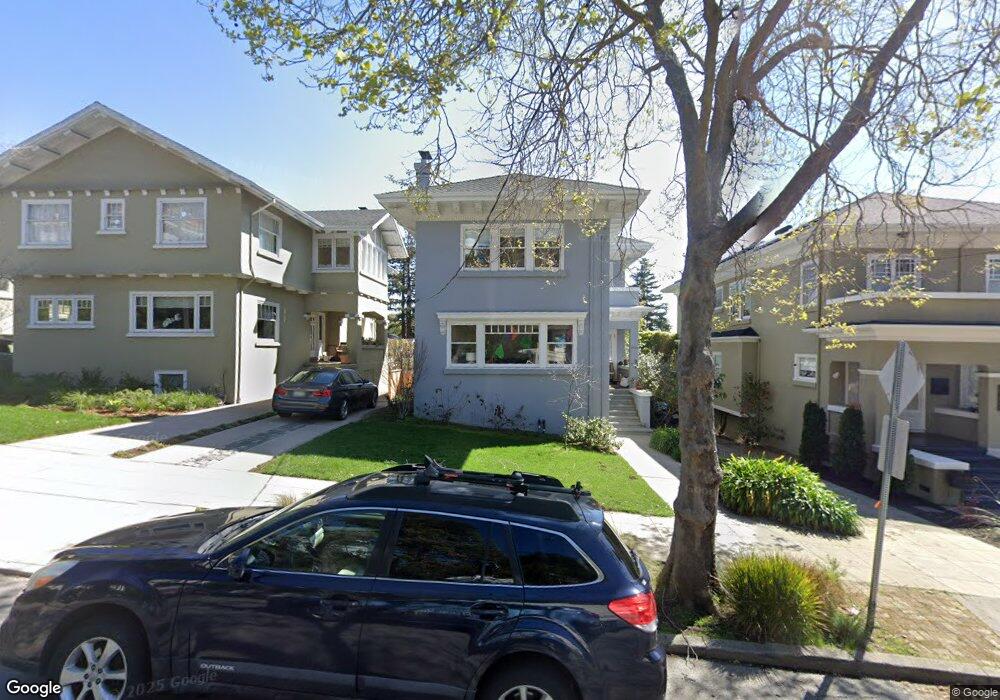
2954 Russell St Berkeley, CA 94705
Claremont NeighborhoodEstimated Value: $2,454,000 - $2,892,000
4
Beds
3
Baths
3,509
Sq Ft
$765/Sq Ft
Est. Value
About This Home
This home is located at 2954 Russell St, Berkeley, CA 94705 and is currently estimated at $2,683,024, approximately $764 per square foot. 2954 Russell St is a home located in Alameda County with nearby schools including John Muir Elementary School, Emerson Elementary School, and Malcolm X Elementary School.
Ownership History
Date
Name
Owned For
Owner Type
Purchase Details
Closed on
Jan 14, 2002
Sold by
Kirchner Diane M and Kirchner Paul C
Bought by
Robarts Michael A and Robarts Julia B
Current Estimated Value
Home Financials for this Owner
Home Financials are based on the most recent Mortgage that was taken out on this home.
Original Mortgage
$600,000
Outstanding Balance
$233,472
Interest Rate
6.37%
Estimated Equity
$2,449,552
Purchase Details
Closed on
Nov 23, 1994
Sold by
Fischel Irene and Fischel Corinne
Bought by
Kirchner Paul C and Kirchner Diane M
Home Financials for this Owner
Home Financials are based on the most recent Mortgage that was taken out on this home.
Original Mortgage
$388,000
Interest Rate
4.37%
Purchase Details
Closed on
Nov 4, 1994
Sold by
Zeffren Jacob
Bought by
Fischel Corinne
Home Financials for this Owner
Home Financials are based on the most recent Mortgage that was taken out on this home.
Original Mortgage
$388,000
Interest Rate
4.37%
Create a Home Valuation Report for This Property
The Home Valuation Report is an in-depth analysis detailing your home's value as well as a comparison with similar homes in the area
Home Values in the Area
Average Home Value in this Area
Purchase History
| Date | Buyer | Sale Price | Title Company |
|---|---|---|---|
| Robarts Michael A | $1,005,000 | Old Republic Title Company | |
| Kirchner Paul C | $485,000 | Placer Title Company | |
| Fischel Corinne | -- | Placer Title Company |
Source: Public Records
Mortgage History
| Date | Status | Borrower | Loan Amount |
|---|---|---|---|
| Open | Robarts Michael A | $600,000 | |
| Previous Owner | Kirchner Paul C | $388,000 |
Source: Public Records
Tax History
| Year | Tax Paid | Tax Assessment Tax Assessment Total Assessment is a certain percentage of the fair market value that is determined by local assessors to be the total taxable value of land and additions on the property. | Land | Improvement |
|---|---|---|---|---|
| 2025 | $25,166 | $1,640,059 | $445,375 | $1,194,684 |
| 2024 | $25,166 | $1,553,985 | $436,644 | $1,117,341 |
| 2023 | $24,720 | $1,530,522 | $428,084 | $1,102,438 |
| 2022 | $24,254 | $1,500,513 | $419,691 | $1,080,822 |
| 2021 | $24,303 | $1,471,095 | $411,463 | $1,059,632 |
| 2020 | $22,908 | $1,456,015 | $407,245 | $1,048,770 |
| 2019 | $21,910 | $1,427,470 | $399,261 | $1,028,209 |
| 2018 | $20,577 | $1,318,781 | $391,434 | $927,347 |
| 2017 | $19,289 | $1,279,203 | $383,761 | $895,442 |
| 2016 | $18,636 | $1,254,128 | $376,238 | $877,890 |
Source: Public Records
Map
Nearby Homes
- 2817 Palm Ct
- 190 Stonewall Rd
- 2962 Piedmont Ave
- 2632 Warring St Unit 3
- 641 Alvarado Rd
- 0 Gravatt Dr Unit 41122154
- 2 Gravatt Dr
- 2643 Stuart St
- 1488 Alvarado Rd
- 2601 College Ave Unit 203
- 2601 College Ave Unit 208
- 204 El Camino Real
- 142 Gravatt Dr
- 150 Vicente Rd
- 0 Tunnel Rd
- 2477 Prince St
- 45 Vicente Rd
- 161 Panoramic Way
- 3382 Dwight Way
- 2935 Florence St
- 2950 Russell St
- 2958 Russell St
- 2946 Russell St
- 2962 Russell St
- 2942 Russell St
- 2953 Ashby Ave
- 2951 Ashby Ave
- 2966 Russell St
- 2955 Ashby Ave
- 2945 Ashby Ave
- 2961 Ashby Ave
- 2938 Russell St
- 2939 Ashby Ave
- 2959 Russell St
- 2970 Russell St
- 2955 Russell St
- 2951 Russell St
- 2937 Ashby Ave
- 2924 Claremont Ave
- 2930 Russell St
Your Personal Tour Guide
Ask me questions while you tour the home.