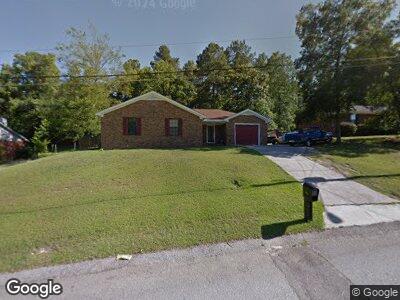
2955 Bridgeport Dr Augusta, GA 30909
Belair NeighborhoodEstimated Value: $198,000 - $216,744
3
Beds
2
Baths
1,524
Sq Ft
$136/Sq Ft
Est. Value
About This Home
This home is located at 2955 Bridgeport Dr, Augusta, GA 30909 and is currently estimated at $206,686, approximately $135 per square foot. 2955 Bridgeport Dr is a home located in Richmond County with nearby schools including Sue Reynolds Elementary School, Langford Middle School, and Johnson Magnet.
Ownership History
Date
Name
Owned For
Owner Type
Purchase Details
Closed on
Oct 19, 2023
Sold by
Harmon James E
Bought by
Harmon James E
Current Estimated Value
Home Financials for this Owner
Home Financials are based on the most recent Mortgage that was taken out on this home.
Original Mortgage
$114,977
Outstanding Balance
$113,754
Interest Rate
7.19%
Mortgage Type
FHA
Estimated Equity
$105,199
Purchase Details
Closed on
Jan 25, 2001
Sold by
Annonio William W and Skeen Sandra D
Bought by
Harmon James E and Harmon Maxine M
Home Financials for this Owner
Home Financials are based on the most recent Mortgage that was taken out on this home.
Original Mortgage
$79,256
Interest Rate
7.44%
Purchase Details
Closed on
Dec 4, 1990
Sold by
Nordahl Buil and Nordahl Buil Jack R
Bought by
Annonio William W
Purchase Details
Closed on
Sep 18, 1990
Sold by
Jack Bowles Builder
Bought by
Jack R Nordahl Buil
Create a Home Valuation Report for This Property
The Home Valuation Report is an in-depth analysis detailing your home's value as well as a comparison with similar homes in the area
Home Values in the Area
Average Home Value in this Area
Purchase History
| Date | Buyer | Sale Price | Title Company |
|---|---|---|---|
| Harmon James E | -- | -- | |
| Harmon James E | $80,500 | -- | |
| Annonio William W | $71,900 | -- | |
| Jack R Nordahl Buil | $40,000 | -- |
Source: Public Records
Mortgage History
| Date | Status | Borrower | Loan Amount |
|---|---|---|---|
| Open | Harmon James E | $114,977 | |
| Previous Owner | Harmon James E | $8,631 | |
| Previous Owner | Harmon James E | $79,256 |
Source: Public Records
Tax History Compared to Growth
Tax History
| Year | Tax Paid | Tax Assessment Tax Assessment Total Assessment is a certain percentage of the fair market value that is determined by local assessors to be the total taxable value of land and additions on the property. | Land | Improvement |
|---|---|---|---|---|
| 2024 | $1,016 | $77,864 | $10,600 | $67,264 |
| 2023 | $1,016 | $75,124 | $10,600 | $64,524 |
| 2022 | $1,000 | $63,375 | $10,600 | $52,775 |
| 2021 | $921 | $50,262 | $10,600 | $39,662 |
| 2020 | $927 | $50,262 | $10,600 | $39,662 |
| 2019 | $832 | $39,710 | $8,480 | $31,230 |
| 2018 | $835 | $39,710 | $8,480 | $31,230 |
| 2017 | $796 | $39,710 | $8,480 | $31,230 |
| 2016 | $797 | $39,710 | $8,480 | $31,230 |
| 2015 | $1,492 | $39,710 | $8,480 | $31,230 |
| 2014 | $1,494 | $39,710 | $8,480 | $31,230 |
Source: Public Records
Map
Nearby Homes
- 3204 Bel Ridge Rd
- 3920 Carolyn St
- 4413 Silverton Rd
- 4301 Leadville Ct
- 1609 Orange Ave
- 4521 Logans Way
- 3305 Bingham Ct
- 4524 Logans Way
- 4086 Harper Franklin Ave
- 2703 Devereux Dr
- 3908 Padrick St
- 3655 Crawfordville Dr
- 2344 Belair Spring Rd
- 729 Holderness Ct
- 9025 Baker Ct
- 4042 Cottingham Way
- 5131 Wheeler Lake Rd
- 7020 Reagan Cir
- 1068 Burlington Dr
- 1060 Burlington Dr
- 2955 Bridgeport Dr
- 2953 Bridgeport Dr
- 2957 Bridgeport Dr
- 2951 Bridgeport Dr
- 2952 Bridgeport Dr
- 2950 Bridgeport Dr
- 2959 Bridgeport Dr
- 3853 Belair Rd
- 2954 Bridgeport Dr
- 3001 Mabus Dr
- 2956 Bridgeport Dr
- 2949 Bridgeport Dr
- 2961 Bridgeport Dr
- 2958 Bridgeport Dr
- 3847 Belair Place
- 3003 Mabus Dr
- 3845 Belair Place
- 3849 Belair Place
- 3857 Belair Rd
- 2947 Bridgeport Dr