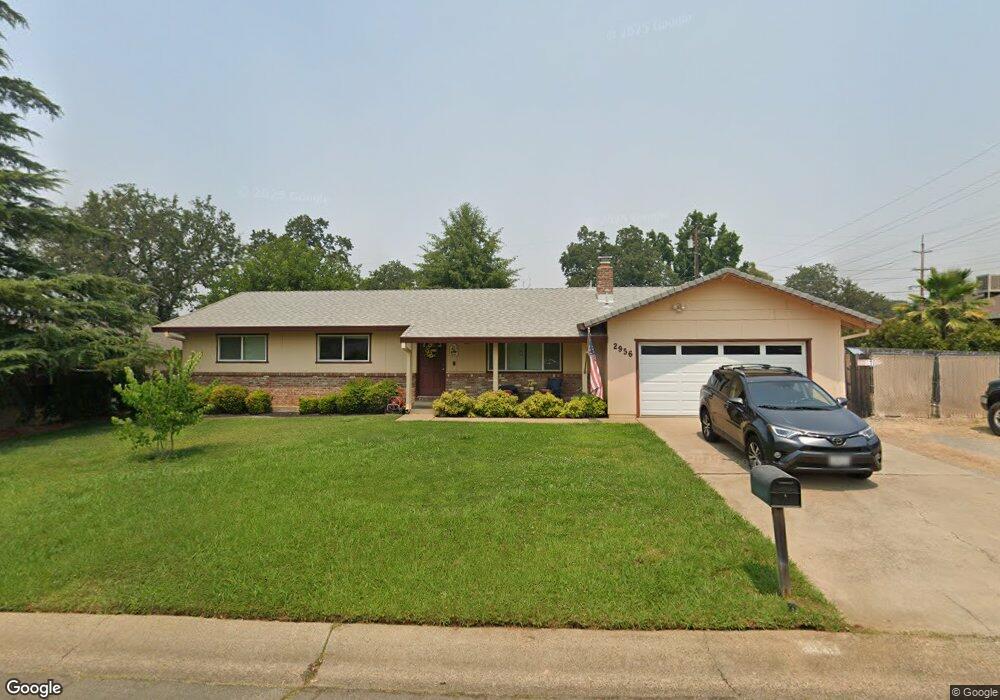
2956 Squire Ave Redding, CA 96002
Shasta View NeighborhoodEstimated Value: $357,456 - $385,000
3
Beds
2
Baths
1,600
Sq Ft
$233/Sq Ft
Est. Value
About This Home
This home is located at 2956 Squire Ave, Redding, CA 96002 and is currently estimated at $373,114, approximately $233 per square foot. 2956 Squire Ave is a home located in Shasta County with nearby schools including Shasta Meadows Elementary School, Parsons Junior High School, and Enterprise High School.
Ownership History
Date
Name
Owned For
Owner Type
Purchase Details
Closed on
Jul 9, 2021
Sold by
Graves Robin and Graves Ami
Bought by
Graves Robin G and Graves Ami E
Current Estimated Value
Purchase Details
Closed on
Aug 28, 2014
Sold by
Graves Ami and Graves Robin
Bought by
Graves Robin and Graves Ami
Home Financials for this Owner
Home Financials are based on the most recent Mortgage that was taken out on this home.
Original Mortgage
$32,000
Outstanding Balance
$24,462
Interest Rate
4.1%
Mortgage Type
Credit Line Revolving
Estimated Equity
$348,652
Purchase Details
Closed on
Feb 2, 2010
Sold by
Helmbold Robert J and Helmbold Jennifer F
Bought by
Graves Ami and Graves Robin
Home Financials for this Owner
Home Financials are based on the most recent Mortgage that was taken out on this home.
Original Mortgage
$191,468
Interest Rate
5.25%
Mortgage Type
FHA
Create a Home Valuation Report for This Property
The Home Valuation Report is an in-depth analysis detailing your home's value as well as a comparison with similar homes in the area
Home Values in the Area
Average Home Value in this Area
Purchase History
| Date | Buyer | Sale Price | Title Company |
|---|---|---|---|
| Graves Robin G | -- | None Available | |
| Graves Robin | -- | Fidelity National Title Co | |
| Graves Ami | $195,000 | Fidelity Natl Title Co Of Ca |
Source: Public Records
Mortgage History
| Date | Status | Borrower | Loan Amount |
|---|---|---|---|
| Open | Graves Robin | $32,000 | |
| Open | Graves Robin | $161,250 | |
| Closed | Graves Ami | $191,468 |
Source: Public Records
Tax History
| Year | Tax Paid | Tax Assessment Tax Assessment Total Assessment is a certain percentage of the fair market value that is determined by local assessors to be the total taxable value of land and additions on the property. | Land | Improvement |
|---|---|---|---|---|
| 2025 | $2,664 | $251,696 | $45,171 | $206,525 |
| 2024 | $2,626 | $246,762 | $44,286 | $202,476 |
| 2023 | $2,626 | $241,924 | $43,418 | $198,506 |
| 2022 | $2,550 | $237,181 | $42,567 | $194,614 |
| 2021 | $2,462 | $232,532 | $41,733 | $190,799 |
| 2020 | $2,450 | $230,149 | $41,306 | $188,843 |
| 2019 | $2,429 | $225,638 | $40,497 | $185,141 |
| 2018 | $2,276 | $210,000 | $50,000 | $160,000 |
| 2017 | $2,247 | $200,000 | $50,000 | $150,000 |
| 2016 | $1,815 | $170,000 | $42,000 | $128,000 |
| 2015 | $1,773 | $165,000 | $40,000 | $125,000 |
| 2014 | $1,783 | $164,000 | $30,000 | $134,000 |
Source: Public Records
Map
Nearby Homes
- 2912 Squire Ave
- 3035 Argyle Rd
- 2571 Erin Ln
- 3385 Wimbledon Dr
- 0 Shasta View Unit 25-1945
- 3183 Agassi Ln
- 2295 Chelsa Cir
- 3685 Wimbledon Dr
- 3512 Capricorn Way
- 2354 Suzette Ave
- 2498 Saturn Skyway
- 2115 Hawn Ave
- 2385 Shining Star Way
- 3361 Alta Mesa Dr
- 3792 Thomason Trail
- 3733 Capricorn Way
- 3688 Polaris Way
- 3863 Indian Wells Ln
- 2332 Venus Way
- 1877 Wheeler St
- 2940 Squire Ave
- 2810 Goodwater Ave
- 2957 Wilson Ave
- 2941 Wilson Ave
- 2790 Goodwater Ave
- 2941 Squire Ave
- 2957 Squire Ave
- 2924 Squire Ave
- 2840 Goodwater Ave
- 2925 Wilson Ave
- 2960 Hawn Ave
- 2944 Hawn Ave
- 2958 Wilson Ave
- 2913 Wilson Ave
- 2974 Wilson Ave
- 2942 Wilson Ave
- 2911 Squire Ave
- 2928 Hawn Ave
- 2926 Wilson Ave
- 2896 Squire Ave
Your Personal Tour Guide
Ask me questions while you tour the home.