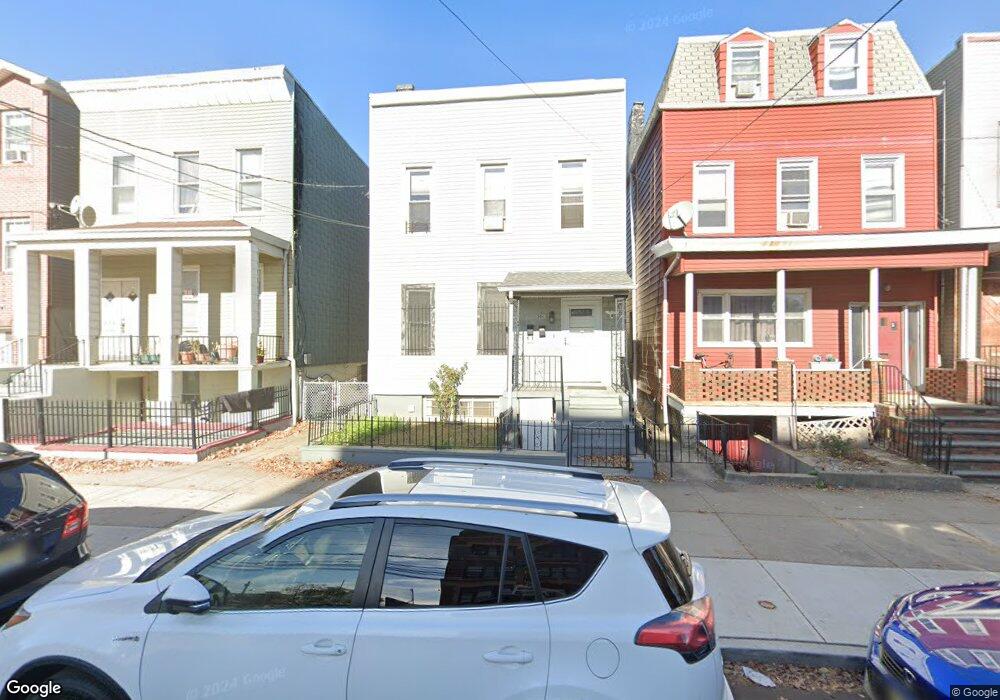
296 Sip Ave Unit 2 Jersey City, NJ 07306
West Side NeighborhoodEstimated Value: $568,130 - $770,000
3
Beds
1
Bath
1,682
Sq Ft
$396/Sq Ft
Est. Value
About This Home
This home is located at 296 Sip Ave Unit 2, Jersey City, NJ 07306 and is currently estimated at $665,533, approximately $395 per square foot. 296 Sip Ave Unit 2 is a home located in Hudson County with nearby schools including P.S. 23 Mahatma K. Gandhi School, Liberty High School, and William L. Dickinson High School.
Ownership History
Date
Name
Owned For
Owner Type
Purchase Details
Closed on
Aug 13, 2012
Sold by
Ladd David F
Bought by
Raha Rupak and Raha Bandana
Current Estimated Value
Home Financials for this Owner
Home Financials are based on the most recent Mortgage that was taken out on this home.
Original Mortgage
$187,500
Outstanding Balance
$129,524
Interest Rate
3.61%
Mortgage Type
New Conventional
Estimated Equity
$536,009
Purchase Details
Closed on
Apr 29, 2005
Sold by
Monserrate Mark
Bought by
Ladd David F
Home Financials for this Owner
Home Financials are based on the most recent Mortgage that was taken out on this home.
Original Mortgage
$298,288
Interest Rate
5.75%
Mortgage Type
Fannie Mae Freddie Mac
Purchase Details
Closed on
Dec 8, 1997
Sold by
Boresky Thomas and Boresky Constance
Bought by
Monserrate Mark
Home Financials for this Owner
Home Financials are based on the most recent Mortgage that was taken out on this home.
Original Mortgage
$104,500
Interest Rate
7.11%
Create a Home Valuation Report for This Property
The Home Valuation Report is an in-depth analysis detailing your home's value as well as a comparison with similar homes in the area
Home Values in the Area
Average Home Value in this Area
Purchase History
| Date | Buyer | Sale Price | Title Company |
|---|---|---|---|
| Raha Rupak | $250,000 | Fidelity National Title Ins | |
| Ladd David F | $372,860 | Top Priority Title Agency In | |
| Monserrate Mark | $110,000 | First American |
Source: Public Records
Mortgage History
| Date | Status | Borrower | Loan Amount |
|---|---|---|---|
| Open | Raha Rupak | $187,500 | |
| Previous Owner | Ladd David F | $55,929 | |
| Previous Owner | Ladd David F | $298,288 | |
| Previous Owner | Monserrate Mark | $104,500 |
Source: Public Records
Tax History Compared to Growth
Tax History
| Year | Tax Paid | Tax Assessment Tax Assessment Total Assessment is a certain percentage of the fair market value that is determined by local assessors to be the total taxable value of land and additions on the property. | Land | Improvement |
|---|---|---|---|---|
| 2025 | $8,485 | $380,000 | $180,000 | $200,000 |
| 2024 | $8,539 | $380,000 | $180,000 | $200,000 |
| 2023 | $8,539 | $380,000 | $180,000 | $200,000 |
| 2022 | $8,048 | $380,000 | $180,000 | $200,000 |
| 2021 | $6,095 | $380,000 | $180,000 | $200,000 |
| 2020 | $6,118 | $380,000 | $180,000 | $200,000 |
| 2019 | $6,268 | $407,000 | $180,000 | $227,000 |
| 2018 | $1,220 | $407,000 | $180,000 | $227,000 |
| 2017 | $6,396 | $82,000 | $20,000 | $62,000 |
| 2016 | $6,315 | $82,000 | $20,000 | $62,000 |
| 2015 | $6,096 | $92,000 | $20,000 | $72,000 |
| 2014 | $6,839 | $92,000 | $20,000 | $72,000 |
Source: Public Records
Map
Nearby Homes
- 30 Logan Ave
- 274 Sip Ave
- 10 Bryant Ave
- 32 Giles Ave
- 84 Logan Ave
- 40 Wright Ave
- 57 Corbin Ave Unit 33
- 57 Corbin Ave Unit 44
- 46 Wright Ave
- 936 Pavonia Ave Unit 3A
- 58 Giles Ave Unit 2
- 43-49 van Wagenen Ave Unit 4A
- 43-49 van Wagenen Ave Unit GA
- 43 van Wagenen Ave Unit 2B
- 20 Marion Place
- 85 Broadway Unit 1E
- 25 Weldon St
- 91 Romaine Ave
- 95 Romaine Ave Unit 5
- 121 Dekalb Ave