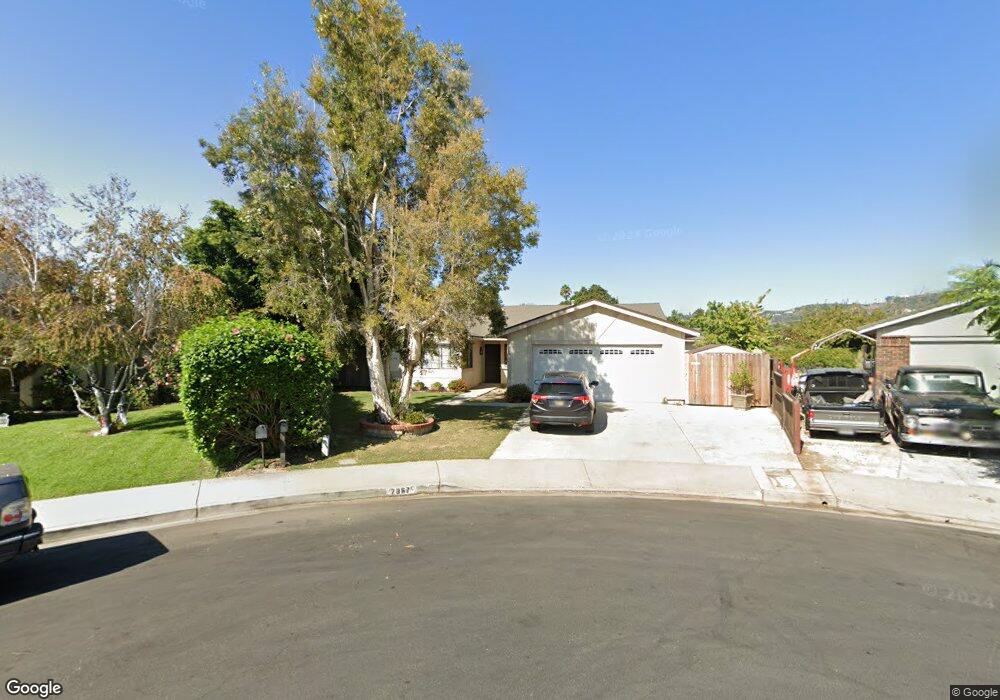
2967 Algonquin Ct Camarillo, CA 93010
Estimated Value: $990,175 - $1,031,000
4
Beds
3
Baths
1,783
Sq Ft
$566/Sq Ft
Est. Value
About This Home
This home is located at 2967 Algonquin Ct, Camarillo, CA 93010 and is currently estimated at $1,008,794, approximately $565 per square foot. 2967 Algonquin Ct is a home located in Ventura County with nearby schools including Dos Caminos Elementary School, Las Colinas Middle School, and Adolfo Camarillo High School.
Ownership History
Date
Name
Owned For
Owner Type
Purchase Details
Closed on
Oct 15, 2012
Sold by
Tovar Richard I
Bought by
Tovar Ii Richard I
Current Estimated Value
Home Financials for this Owner
Home Financials are based on the most recent Mortgage that was taken out on this home.
Original Mortgage
$236,012
Outstanding Balance
$162,272
Interest Rate
3.36%
Mortgage Type
New Conventional
Estimated Equity
$846,522
Purchase Details
Closed on
Jul 24, 2002
Sold by
Tovar Betty Ann
Bought by
Tovar Ii Richard I
Purchase Details
Closed on
Sep 13, 2001
Sold by
Surad Michelle
Bought by
Tovar Ii Richard I and Tovar Betty Ann
Home Financials for this Owner
Home Financials are based on the most recent Mortgage that was taken out on this home.
Original Mortgage
$275,000
Interest Rate
6.99%
Purchase Details
Closed on
Jun 12, 1998
Sold by
Surad Gary S
Bought by
Surad Dorothy M
Create a Home Valuation Report for This Property
The Home Valuation Report is an in-depth analysis detailing your home's value as well as a comparison with similar homes in the area
Home Values in the Area
Average Home Value in this Area
Purchase History
| Date | Buyer | Sale Price | Title Company |
|---|---|---|---|
| Tovar Ii Richard I | -- | Servicelink | |
| Tovar Ii Richard I | -- | -- | |
| Tovar Ii Richard I | $375,000 | Fidelity National Title Co | |
| Surad Dorothy M | -- | -- |
Source: Public Records
Mortgage History
| Date | Status | Borrower | Loan Amount |
|---|---|---|---|
| Open | Tovar Ii Richard I | $236,012 | |
| Closed | Tovar Ii Richard I | $275,000 |
Source: Public Records
Tax History
| Year | Tax Paid | Tax Assessment Tax Assessment Total Assessment is a certain percentage of the fair market value that is determined by local assessors to be the total taxable value of land and additions on the property. | Land | Improvement |
|---|---|---|---|---|
| 2025 | $6,107 | $553,809 | $221,524 | $332,285 |
| 2024 | $6,107 | $542,950 | $217,180 | $325,770 |
| 2023 | $5,889 | $532,304 | $212,921 | $319,383 |
| 2022 | $5,872 | $521,867 | $208,746 | $313,121 |
| 2021 | $5,661 | $511,635 | $204,653 | $306,982 |
| 2020 | $5,641 | $506,390 | $202,555 | $303,835 |
| 2019 | $5,616 | $496,462 | $198,584 | $297,878 |
| 2018 | $5,513 | $486,729 | $194,691 | $292,038 |
| 2017 | $5,190 | $477,186 | $190,874 | $286,312 |
| 2016 | $5,066 | $467,831 | $187,132 | $280,699 |
| 2015 | $5,013 | $460,806 | $184,322 | $276,484 |
| 2014 | $4,897 | $451,781 | $180,712 | $271,069 |
Source: Public Records
Map
Nearby Homes
- 1727 Loma Dr
- 1772 Weston Cir
- 1874 Munson St
- 3475 E Karena Ct
- 527 Keyser Rondo
- 3623 Corona St
- 958 Palmer Ave
- 2174 Wilcox St
- 2228 Camilar Dr
- 2178 Westwood Dr
- 2103 Euclid Ave
- 647 Arneill Rd
- 2201 Camilar Dr
- 2496 Parkway Dr
- 3429 Rio Hato Ct
- 2674 Tanglewood St
- 2623 Antonio Dr Unit 106
- 1709 Las Posas Rd
- 2696 Antonio Dr
- 2713 Antonio Dr Unit 312
- 2979 Algonquin Ct
- 1340 Cherokee Ct
- 2955 Algonquin Ct
- 1338 Cherokee Ct
- 1344 Cherokee Ct
- 2943 Algonquin Ct
- 2990 Algonquin Ct
- 2978 Algonquin Ct
- 2966 Algonquin Ct
- 2931 Algonquin Ct
- 1334 Cherokee Ct
- 1348 Cherokee Ct
- 2919 Algonquin Ct
- 2954 Algonquin Ct
- 1368 Vista Ct
- 1330 Cherokee Ct
- 1407 Kendall Ave
- 1354 Cherokee Ct
- 1370 Vista Ct
- 2942 Algonquin Ct
Your Personal Tour Guide
Ask me questions while you tour the home.