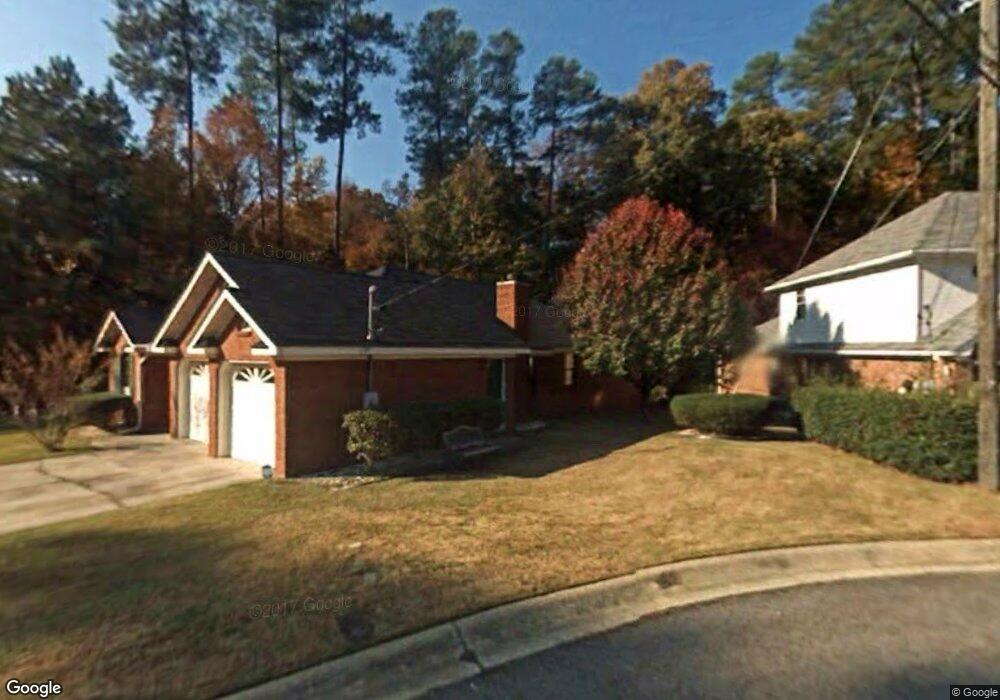
2969 Pointewest Dr Augusta, GA 30909
West Augusta NeighborhoodEstimated Value: $247,000 - $291,000
3
Beds
2
Baths
1,808
Sq Ft
$152/Sq Ft
Est. Value
About This Home
This home is located at 2969 Pointewest Dr, Augusta, GA 30909 and is currently estimated at $274,013, approximately $151 per square foot. 2969 Pointewest Dr is a home located in Richmond County with nearby schools including Tutt Middle School, Johnson Magnet, and Westside High School.
Ownership History
Date
Name
Owned For
Owner Type
Purchase Details
Closed on
May 15, 2014
Sold by
Phillips Johnnie G
Bought by
Phillips Johnnie G and Phillips Marcus F
Current Estimated Value
Purchase Details
Closed on
Jun 3, 2005
Sold by
Hancock Susan M
Bought by
Phillips Marcus F and Phillips Johnnie G
Purchase Details
Closed on
Jun 23, 1998
Sold by
Morris Elaine G and Gunn Elaine
Bought by
Hancock Susan M
Home Financials for this Owner
Home Financials are based on the most recent Mortgage that was taken out on this home.
Original Mortgage
$111,450
Interest Rate
7.04%
Purchase Details
Closed on
Oct 1, 1992
Sold by
Morris Everette E S
Bought by
Morris Elaine G
Purchase Details
Closed on
Jun 5, 1990
Sold by
Morris Elaine G
Bought by
Morris Everette E
Purchase Details
Closed on
May 15, 1990
Sold by
Blackburn Home Buil
Bought by
Morris Elaine G
Purchase Details
Closed on
Nov 1, 1989
Sold by
Westbrook Of August
Bought by
.E Blackburn Constru
Create a Home Valuation Report for This Property
The Home Valuation Report is an in-depth analysis detailing your home's value as well as a comparison with similar homes in the area
Home Values in the Area
Average Home Value in this Area
Purchase History
| Date | Buyer | Sale Price | Title Company |
|---|---|---|---|
| Phillips Johnnie G | -- | -- | |
| Phillips Marcus F | $125,500 | -- | |
| Hancock Susan M | $114,900 | -- | |
| Morris Elaine G | -- | -- | |
| Morris Everette E | -- | -- | |
| Morris Elaine G | $89,800 | -- | |
| .E Blackburn Constru | $29,600 | -- |
Source: Public Records
Mortgage History
| Date | Status | Borrower | Loan Amount |
|---|---|---|---|
| Previous Owner | Hancock Susan M | $111,450 |
Source: Public Records
Tax History
| Year | Tax Paid | Tax Assessment Tax Assessment Total Assessment is a certain percentage of the fair market value that is determined by local assessors to be the total taxable value of land and additions on the property. | Land | Improvement |
|---|---|---|---|---|
| 2025 | $1,156 | $104,224 | $12,000 | $92,224 |
| 2024 | $1,156 | $88,496 | $12,000 | $76,496 |
| 2023 | $983 | $82,160 | $12,000 | $70,160 |
| 2022 | $943 | $70,337 | $12,000 | $58,337 |
| 2021 | $881 | $58,508 | $12,000 | $46,508 |
| 2020 | $887 | $58,508 | $12,000 | $46,508 |
| 2019 | $892 | $55,725 | $12,000 | $43,725 |
| 2018 | $897 | $55,725 | $12,000 | $43,725 |
| 2017 | $839 | $55,725 | $12,000 | $43,725 |
| 2016 | $834 | $55,296 | $12,000 | $43,296 |
| 2015 | $834 | $55,296 | $12,000 | $43,296 |
| 2014 | $843 | $55,296 | $12,000 | $43,296 |
Source: Public Records
Map
Nearby Homes
- 3007 Pointewest Dr
- 262 Lafayette Dr
- 2609 Sherborne Ct
- 2918 Arrowhead Dr
- 2902 Sussex Rd
- 2908 Stratford Dr
- 104 York Way
- 2330 Lions Gate Dr
- 2507 Pinebluff Ct
- 2703 Oakbluff Ct
- 46 Charlestowne Dr
- 2531 Tupelo Dr
- 427 Aumond Rd
- 35 Charlestowne Dr
- 2817 Brickrun Way
- 2006 Bromley Ct
- 2805 Brickrun Way
- 519 Ashland Dr
- 3082 Westwood Rd
- 3084 Westwood Rd
- 2967 Pointewest Dr
- 3003 Pointewest Dr Unit 2 A
- 3005 Pointewest Dr Unit 2B
- 2965 Pointewest Dr
- 3007 Pointewest Dr Unit 2C
- 2901 Pointewest Dr
- 2903 Pointewest Dr
- 2934 Pointewest Dr
- 2903 Pointe West Dr
- 2903 Pointe Dr W
- 3004 Pointewest Dr
- 3009 Pointewest Dr Unit 2D
- 2906 Pointe West Dr
- 2963 Pointe Dr W
- 3004 Pointewest Dr
- 2963 Pointewest Dr
- 2905 Pointewest Dr
- 2905 Pointe Dr W
- 3006 Pointewest Dr
- 3006 Pointewest Dr
Your Personal Tour Guide
Ask me questions while you tour the home.