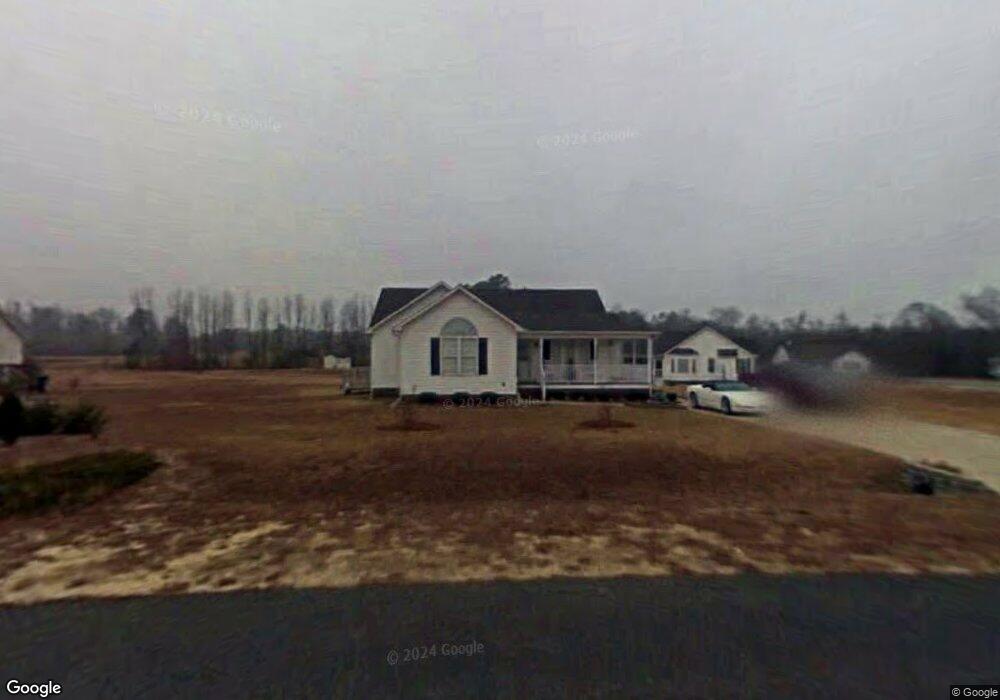
297 Rosa Cir Willow Spring, NC 27592
Pleasant Grove NeighborhoodEstimated Value: $286,000 - $333,000
3
Beds
2
Baths
1,327
Sq Ft
$233/Sq Ft
Est. Value
About This Home
This home is located at 297 Rosa Cir, Willow Spring, NC 27592 and is currently estimated at $309,589, approximately $233 per square foot. 297 Rosa Cir is a home located in Johnston County with nearby schools including Dixon Road Elementary School, McGee's Crossroads Middle School, and West Johnston High School.
Ownership History
Date
Name
Owned For
Owner Type
Purchase Details
Closed on
Apr 4, 2014
Sold by
Passman Chad L and Passman Jennifer V
Bought by
Flores Malissa M and Flores Rodriguez Jesus O
Current Estimated Value
Home Financials for this Owner
Home Financials are based on the most recent Mortgage that was taken out on this home.
Original Mortgage
$117,800
Outstanding Balance
$89,516
Interest Rate
4.33%
Mortgage Type
New Conventional
Estimated Equity
$220,073
Purchase Details
Closed on
Jan 3, 2011
Sold by
Pritt Donna Faye
Bought by
Passman Chad L and Passman Jennifer V
Home Financials for this Owner
Home Financials are based on the most recent Mortgage that was taken out on this home.
Original Mortgage
$123,315
Interest Rate
4.37%
Mortgage Type
FHA
Purchase Details
Closed on
May 22, 2003
Sold by
Pritt Donna Faye
Bought by
Allan Canady Builder Inc
Purchase Details
Closed on
Apr 18, 2002
Sold by
Allan Canady Builder Inc
Bought by
Double J Ranch Dev Co, Llc
Create a Home Valuation Report for This Property
The Home Valuation Report is an in-depth analysis detailing your home's value as well as a comparison with similar homes in the area
Home Values in the Area
Average Home Value in this Area
Purchase History
| Date | Buyer | Sale Price | Title Company |
|---|---|---|---|
| Flores Malissa M | $124,000 | None Available | |
| Passman Chad L | $127,000 | None Available | |
| Allan Canady Builder Inc | $108,000 | -- | |
| Double J Ranch Dev Co, Llc | $28,000 | -- |
Source: Public Records
Mortgage History
| Date | Status | Borrower | Loan Amount |
|---|---|---|---|
| Open | Flores Malissa M | $117,800 | |
| Previous Owner | Passman Chad L | $123,315 |
Source: Public Records
Tax History
| Year | Tax Paid | Tax Assessment Tax Assessment Total Assessment is a certain percentage of the fair market value that is determined by local assessors to be the total taxable value of land and additions on the property. | Land | Improvement |
|---|---|---|---|---|
| 2025 | $1,728 | $272,130 | $73,970 | $198,160 |
| 2024 | $1,298 | $160,210 | $40,680 | $119,530 |
| 2023 | $1,258 | $160,210 | $40,680 | $119,530 |
| 2022 | $1,298 | $160,210 | $40,680 | $119,530 |
| 2021 | $1,298 | $160,210 | $40,680 | $119,530 |
| 2020 | $1,346 | $160,210 | $40,680 | $119,530 |
| 2019 | $1,314 | $160,210 | $40,680 | $119,530 |
| 2018 | $1,049 | $124,920 | $34,210 | $90,710 |
| 2017 | $1,049 | $124,920 | $34,210 | $90,710 |
| 2016 | $1,049 | $124,920 | $34,210 | $90,710 |
| 2015 | $1,049 | $124,920 | $34,210 | $90,710 |
| 2014 | $1,049 | $124,920 | $34,210 | $90,710 |
Source: Public Records
Map
Nearby Homes
- 102 Ina Joe Place
- 420 Beulah Milton Dr
- 127 Wagon Trail
- 1941 White Memorial Church Rd
- 108 Blueberry Ln
- 100 Blackberry Creek Dr
- 443 Tranquil Ln
- 200 Reese Dr
- 55 Dolores Ct
- 34 Summer Ridge Ct
- 85 Landlocked Cir
- 142 Jacqueline Dr
- 57 Bowie Ct
- 136 Pebblestone Ct
- 47 Kiowa Ct
- 158 Linville Ln
- 234 Linville Ln
- 410 Penwood Rd
- 2846 Jackson King Rd
- 3002 Red Cir
Your Personal Tour Guide
Ask me questions while you tour the home.