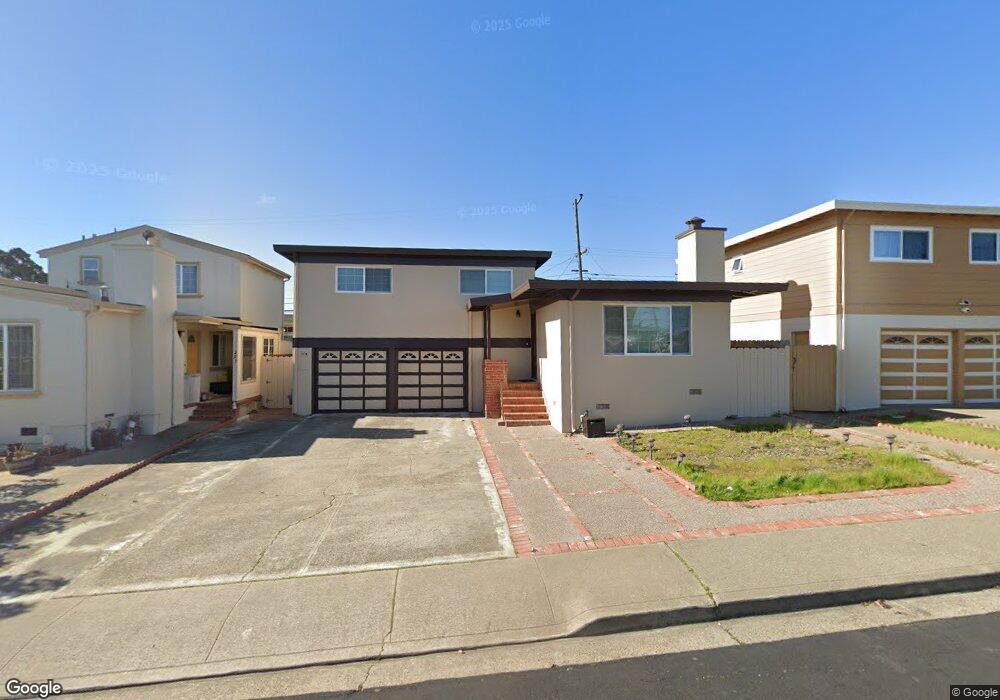
297 Westview Dr South San Francisco, CA 94080
Sunshine Gardens NeighborhoodEstimated Value: $1,215,000 - $1,327,000
3
Beds
2
Baths
1,110
Sq Ft
$1,143/Sq Ft
Est. Value
About This Home
This home is located at 297 Westview Dr, South San Francisco, CA 94080 and is currently estimated at $1,268,792, approximately $1,143 per square foot. 297 Westview Dr is a home located in San Mateo County with nearby schools including Sunshine Gardens Elementary School, Parkway Heights Middle School, and El Camino High School.
Ownership History
Date
Name
Owned For
Owner Type
Purchase Details
Closed on
May 17, 2010
Sold by
Mettle Investments Llc
Bought by
Kwok Sunny Chi Fai
Current Estimated Value
Home Financials for this Owner
Home Financials are based on the most recent Mortgage that was taken out on this home.
Original Mortgage
$363,750
Outstanding Balance
$245,710
Interest Rate
5.21%
Mortgage Type
New Conventional
Estimated Equity
$1,023,082
Purchase Details
Closed on
Feb 22, 2010
Sold by
Hsbc Bank Usa National Association
Bought by
Mettle Investments Llc
Purchase Details
Closed on
Sep 8, 2009
Sold by
Wong See Wan Sylvia
Bought by
Hsbc Bank Usa National Association
Purchase Details
Closed on
Sep 24, 2003
Sold by
Lima Chad B
Bought by
Wong See Wan Sylvia
Home Financials for this Owner
Home Financials are based on the most recent Mortgage that was taken out on this home.
Original Mortgage
$360,000
Interest Rate
4.66%
Mortgage Type
Balloon
Create a Home Valuation Report for This Property
The Home Valuation Report is an in-depth analysis detailing your home's value as well as a comparison with similar homes in the area
Home Values in the Area
Average Home Value in this Area
Purchase History
| Date | Buyer | Sale Price | Title Company |
|---|---|---|---|
| Kwok Sunny Chi Fai | $485,000 | Fidelity National Title Co | |
| Mettle Investments Llc | $470,000 | Chicago Title Company | |
| Hsbc Bank Usa National Association | $387,457 | None Available | |
| Wong See Wan Sylvia | -- | Fidelity National Title Co |
Source: Public Records
Mortgage History
| Date | Status | Borrower | Loan Amount |
|---|---|---|---|
| Open | Kwok Sunny Chi Fai | $363,750 | |
| Previous Owner | Wong See Wan Sylvia | $360,000 |
Source: Public Records
Tax History Compared to Growth
Tax History
| Year | Tax Paid | Tax Assessment Tax Assessment Total Assessment is a certain percentage of the fair market value that is determined by local assessors to be the total taxable value of land and additions on the property. | Land | Improvement |
|---|---|---|---|---|
| 2025 | $7,466 | $626,038 | $313,019 | $313,019 |
| 2023 | $7,466 | $601,730 | $300,865 | $300,865 |
| 2022 | $6,936 | $589,932 | $294,966 | $294,966 |
| 2021 | $6,844 | $578,366 | $289,183 | $289,183 |
| 2020 | $6,758 | $572,436 | $286,218 | $286,218 |
| 2019 | $6,686 | $561,212 | $280,606 | $280,606 |
| 2018 | $6,527 | $550,208 | $275,104 | $275,104 |
| 2017 | $6,354 | $539,420 | $269,710 | $269,710 |
| 2016 | $6,212 | $528,844 | $264,422 | $264,422 |
| 2015 | $6,110 | $520,902 | $260,451 | $260,451 |
| 2014 | $5,977 | $510,700 | $255,350 | $255,350 |
Source: Public Records
Map
Nearby Homes
- 252 Sequoia Ave
- 1488 El Camino Real Unit 211
- 467 Holly Ave
- 889 Mclellan Dr Unit 205
- 889 Mclellan Dr Unit 302
- 829 Stonegate Dr
- 0 Indio Dr
- 728 Cottonwood Ave
- 729 Grand Ave
- 1700 El Camino Real Unit 2-03
- 1700 El Camino Real
- 719 Circle Ct
- 69 Windcrest Ln
- 121 Northcrest Dr
- 556 Keoncrest Dr
- 1 Elkwood Dr
- 645 Baden Ave Unit 4
- 706 Serra Dr
- 3 Bradford Dr
- 632 1st Ln
- 1177 Miller Ave
- 293 Westview Dr
- 289 Westview Dr
- 296 Sequoia Ave
- 292 Sequoia Ave
- 298 Sequoia Ave
- 288 Sequoia Ave
- 1165 Miller Ave
- 285 Westview Dr
- 294 Westview Dr
- 284 Sequoia Ave
- 290 Westview Dr
- 281 Westview Dr
- 286 Westview Dr
- 1159 Miller Ave
- 280 Sequoia Ave
- 282 Westview Dr
- 277 Westview Dr
- 1155 Miller Ave
- 276 Sequoia Ave