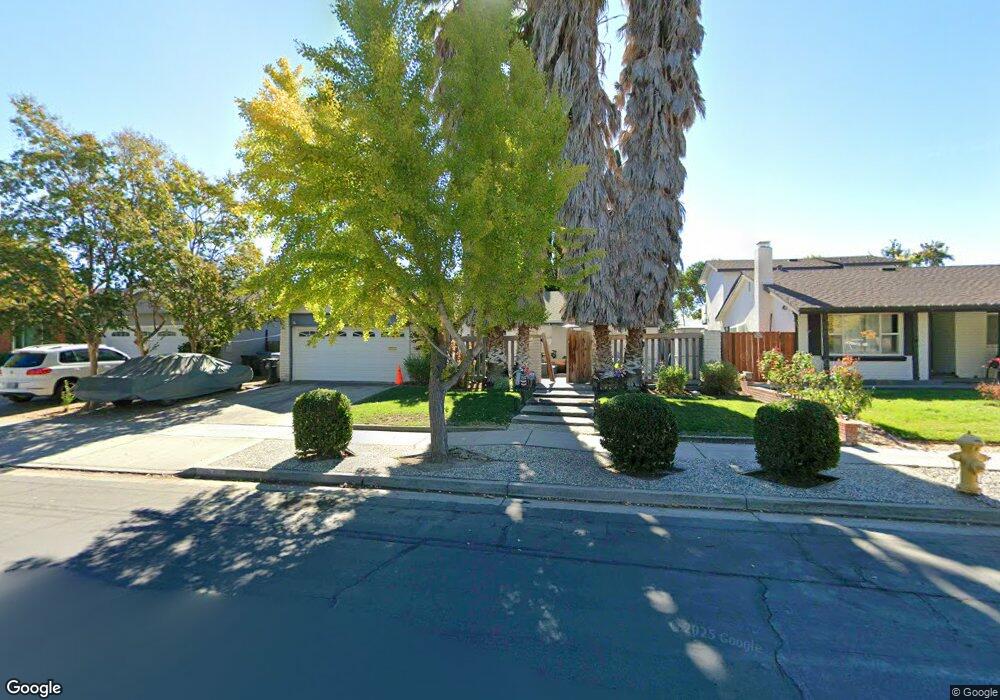
298 Copco Ln San Jose, CA 95123
Miner NeighborhoodEstimated Value: $1,429,180 - $1,547,000
3
Beds
2
Baths
1,543
Sq Ft
$974/Sq Ft
Est. Value
About This Home
This home is located at 298 Copco Ln, San Jose, CA 95123 and is currently estimated at $1,503,045, approximately $974 per square foot. 298 Copco Ln is a home located in Santa Clara County with nearby schools including Oak Ridge Elementary School, Herman (Leonard) Intermediate School, and Oak Grove High School.
Ownership History
Date
Name
Owned For
Owner Type
Purchase Details
Closed on
Aug 4, 2005
Sold by
Juliano Daniel M and Juliano Dawn M
Bought by
Frankina Joseph and Frankina Kristi M
Current Estimated Value
Home Financials for this Owner
Home Financials are based on the most recent Mortgage that was taken out on this home.
Original Mortgage
$580,500
Outstanding Balance
$301,803
Interest Rate
5.5%
Mortgage Type
Purchase Money Mortgage
Estimated Equity
$1,201,242
Purchase Details
Closed on
Aug 17, 1994
Sold by
Matthias John D and Matthias Vivian B
Bought by
Matthias Vivian B
Home Financials for this Owner
Home Financials are based on the most recent Mortgage that was taken out on this home.
Original Mortgage
$197,600
Interest Rate
8.65%
Purchase Details
Closed on
Aug 1, 1994
Sold by
Matthias Vivian B
Bought by
Juliano Daniel M and Juliano Dawn M
Home Financials for this Owner
Home Financials are based on the most recent Mortgage that was taken out on this home.
Original Mortgage
$197,600
Interest Rate
8.65%
Create a Home Valuation Report for This Property
The Home Valuation Report is an in-depth analysis detailing your home's value as well as a comparison with similar homes in the area
Home Values in the Area
Average Home Value in this Area
Purchase History
| Date | Buyer | Sale Price | Title Company |
|---|---|---|---|
| Frankina Joseph | $645,000 | Stewart Title Of California | |
| Matthias Vivian B | -- | Gateway Title Company | |
| Juliano Daniel M | $208,000 | Gateway Title Company |
Source: Public Records
Mortgage History
| Date | Status | Borrower | Loan Amount |
|---|---|---|---|
| Open | Frankina Joseph | $580,500 | |
| Previous Owner | Juliano Daniel M | $197,600 |
Source: Public Records
Tax History Compared to Growth
Tax History
| Year | Tax Paid | Tax Assessment Tax Assessment Total Assessment is a certain percentage of the fair market value that is determined by local assessors to be the total taxable value of land and additions on the property. | Land | Improvement |
|---|---|---|---|---|
| 2025 | $12,274 | $881,091 | $572,591 | $308,500 |
| 2024 | $12,274 | $863,815 | $561,364 | $302,451 |
| 2023 | $12,086 | $846,878 | $550,357 | $296,521 |
| 2022 | $12,000 | $830,273 | $539,566 | $290,707 |
| 2021 | $11,825 | $813,994 | $528,987 | $285,007 |
| 2020 | $11,572 | $805,648 | $523,563 | $282,085 |
| 2019 | $11,303 | $789,852 | $513,298 | $276,554 |
| 2018 | $11,225 | $774,366 | $503,234 | $271,132 |
| 2017 | $11,077 | $759,183 | $493,367 | $265,816 |
| 2016 | $9,690 | $677,000 | $439,900 | $237,100 |
| 2015 | $9,170 | $643,000 | $417,900 | $225,100 |
| 2014 | $7,922 | $595,000 | $386,700 | $208,300 |
Source: Public Records
Map
Nearby Homes
- 0 Deer Valley Rd Unit 225017975
- 5865 Paddon Cir
- 259 Omira Dr
- 233 Omira Dr
- 379 Roan St
- 394 Bay St
- 5631 Herma St
- 323 Blossom Hill Rd Unit 2
- 329 Blossom Hill Rd Unit 4
- 5629 Judith St
- 5532 Spinnaker Dr Unit 2
- 341 Blossom Hill Rd Unit 3
- 5503 Eagles Ln Unit 2
- 262 Tradewinds Ct Unit 4
- 195 Blossom Hill Rd Unit 242
- 195 Blossom Hill Rd Unit 118
- 195 Blossom Hill Rd Unit 229
- 195 Blossom Hill Rd Unit 276
- 195 Blossom Hill Rd Unit 215
- 5968 Sorrel Ave