B
Seller's Agent in 2026
Bret Cochran
Redfin Corporation
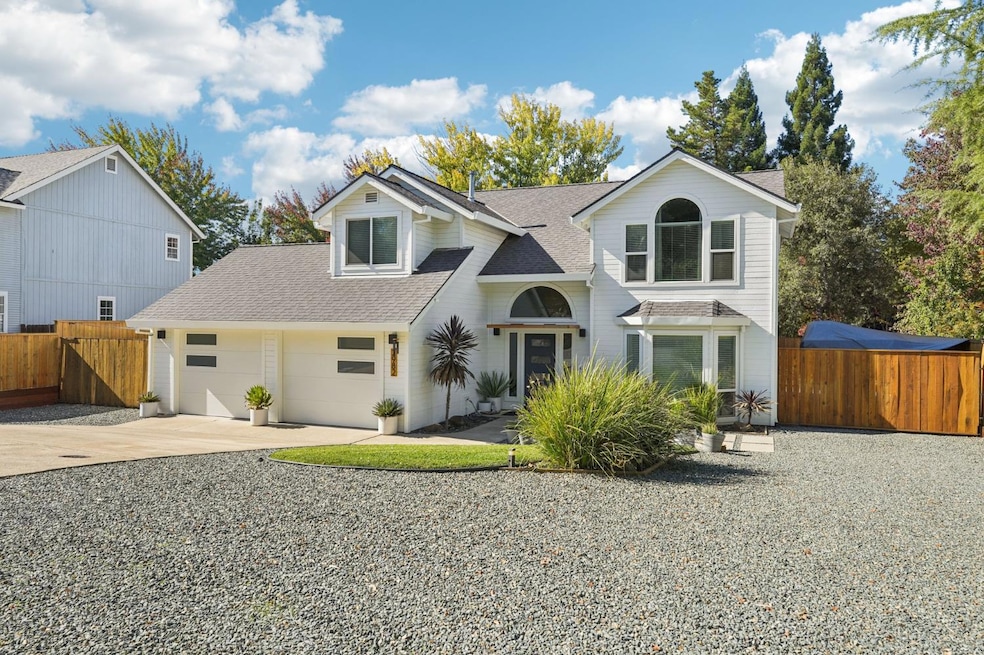
PRICE IMPROVEMENT on this beautifully maintained home that blends foothills living with modern coastal-mountain style. Nestled adjacent to El Dorado Hills on a quiet cul-de-sac, this home reflects true pride of ownership - offering thoughtfully updated spaces, a light and airy setting and flexible outdoor space. The open-concept layout features plenty of natural light and a stylish living area anchored by a pellet stove. The kitchen has been tastefully updated with granite countertops, newer appliances and a large island for gathering and entertaining. The adjoining dining room is perfect for hosting family and friends and flows nicely into a stylish living room. Four bedrooms provide for a variety of uses - from traditional bedrooms, to office space, to workout / hobby rooms. The oversized backyard features a well established garden, low maintenance landscaping and plenty of room for entertaining, RV's, boats and more. Functional improvements to the home include a newer roof, newer AC and newer windows. Located just minutes from Hwy 50, top-rated schools and outdoor recreation this home offers the perfect balance of convenience and seclusion. If you're looking for a home that combines style, setting and quality - 2982 Windsor Ct is a must-see!
Last Agent to Sell the Property
Bret Cochran
Redfin Corporation License #02162915 Listed on: 10/23/2025

| Date | Type | Sale Price | Title Company |
|---|---|---|---|
| Grant Deed | $685,000 | Rocket Close And Title Inc | |
| Interfamily Deed Transfer | -- | None Available | |
| Interfamily Deed Transfer | -- | None Available | |
| Grant Deed | -- | None Available | |
| Interfamily Deed Transfer | -- | None Available | |
| Gift Deed | -- | -- | |
| Grant Deed | $186,500 | Fidelity National Title Co |
| Date | Status | Loan Amount | Loan Type |
|---|---|---|---|
| Open | $635,000 | VA | |
| Previous Owner | $167,850 | No Value Available |
| Date | Event | Price | List to Sale | Price per Sq Ft |
|---|---|---|---|---|
| 01/07/2026 01/07/26 | Sold | $685,000 | -2.0% | $334 / Sq Ft |
| 12/15/2025 12/15/25 | Pending | -- | -- | -- |
| 12/03/2025 12/03/25 | Price Changed | $699,000 | -2.8% | $341 / Sq Ft |
| 11/11/2025 11/11/25 | For Sale | $719,000 | +5.0% | $351 / Sq Ft |
| 11/06/2025 11/06/25 | Off Market | $685,000 | -- | -- |
| 10/23/2025 10/23/25 | For Sale | $719,000 | -- | $351 / Sq Ft |
| Year | Tax Paid | Tax Assessment Tax Assessment Total Assessment is a certain percentage of the fair market value that is determined by local assessors to be the total taxable value of land and additions on the property. | Land | Improvement |
|---|---|---|---|---|
| 2025 | $3,129 | $297,754 | $79,818 | $217,936 |
| 2024 | $3,129 | $291,916 | $78,253 | $213,663 |
| 2023 | $3,072 | $286,193 | $76,719 | $209,474 |
| 2022 | $3,030 | $280,582 | $75,215 | $205,367 |
| 2021 | $2,993 | $275,082 | $73,741 | $201,341 |
| 2020 | $2,953 | $272,262 | $72,985 | $199,277 |
| 2019 | $2,901 | $266,924 | $71,554 | $195,370 |
| 2018 | $2,820 | $261,691 | $70,151 | $191,540 |
| 2017 | $2,768 | $256,561 | $68,776 | $187,785 |
| 2016 | $2,736 | $251,531 | $67,428 | $184,103 |
| 2015 | $2,641 | $247,755 | $66,416 | $181,339 |
| 2014 | $2,641 | $242,904 | $65,116 | $177,788 |
B
Seller's Agent in 2026
Bret Cochran
Redfin Corporation
Buyer's Agent in 2026
Mela Fratarcangeli
Onyx Real Estate
(916) 990-8971
17 in this area
180 Total Sales
Source: MetroList
MLS Number: 225135507
APN: 102-432-012-000
Disclaimer: Certain information contained herein is derived from information provided by parties other than Homes.com. All information provided is deemed reliable, but is not guaranteed to be accurate and should be independently verified.
![]() IDX information is provided exclusively for personal, non-commercial use, and may not be used for any purpose other than to identify prospective properties consumers may be interested in purchasing. Information is deemed reliable but not guaranteed.
IDX information is provided exclusively for personal, non-commercial use, and may not be used for any purpose other than to identify prospective properties consumers may be interested in purchasing. Information is deemed reliable but not guaranteed.
Ask me questions while you tour the home.