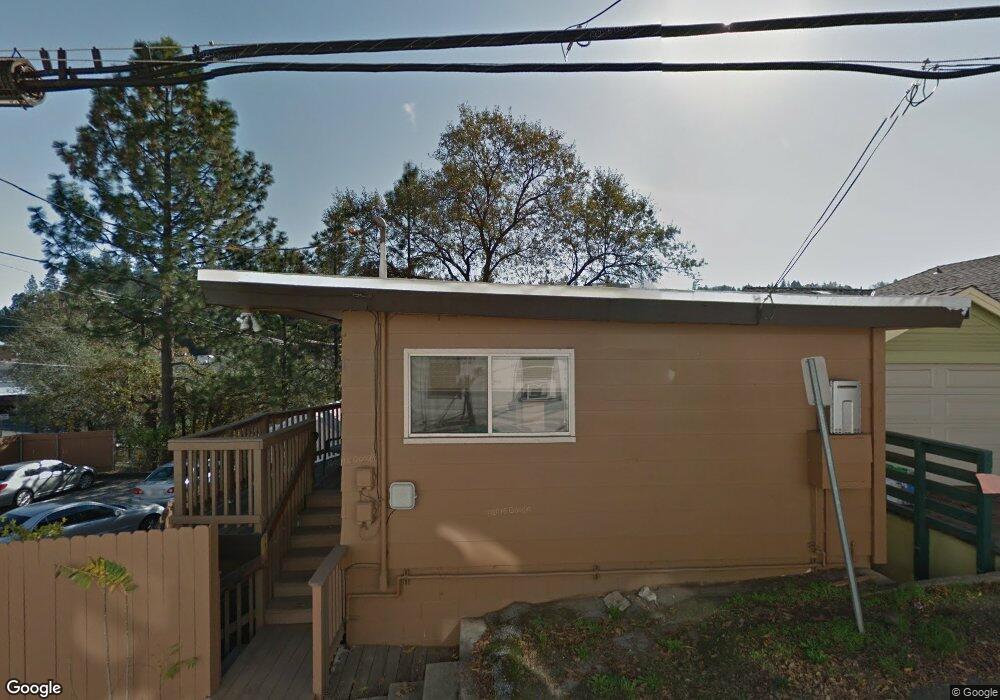
2986 Coloma St Placerville, CA 95667
Estimated Value: $440,564 - $491,000
About This Home
This home is located at 2986 Coloma St, Placerville, CA 95667 and is currently estimated at $474,391. 2986 Coloma St is a home located in El Dorado County with nearby schools including El Dorado High School, Country Day Montessori, and El Dorado Adventist School.
Ownership History
We collect this data history from publicly available records. To have your information removed, we recommend requesting removal directly through your county’s website.
Purchase Details
Home Financials for this Owner
Home Financials are based on the most recent Mortgage that was taken out on this home.Purchase Details
Home Financials for this Owner
Home Financials are based on the most recent Mortgage that was taken out on this home.Purchase Details
Home Values in the Area
Average Home Value in this Area
Purchase History
We collect this data history from publicly available records. To have your information removed, we recommend requesting removal directly through your county’s website.
| Date | Buyer | Sale Price | Title Company |
|---|---|---|---|
| $190,000 | Chicago Title Co | ||
| $138,000 | Inter County Title Co | ||
| $120,000 | Inter County Title Co |
Mortgage History
We collect this data history from publicly available records. To have your information removed, we recommend requesting removal directly through your county’s website.
| Date | Status | Borrower | Loan Amount |
|---|---|---|---|
| Open | $94,750 | ||
| Previous Owner | $93,000 | ||
| Closed | $75,800 |
Tax History
We collect this data history from publicly available records. To have your information removed, we recommend requesting removal directly through your county’s website.
| Year | Tax Paid | Tax Assessment Tax Assessment Total Assessment is a certain percentage of the fair market value that is determined by local assessors to be the total taxable value of land and additions on the property. | Land | Improvement |
|---|---|---|---|---|
| 2025 | $2,914 | $279,916 | $85,666 | $194,250 |
| 2024 | $2,914 | $274,429 | $83,987 | $190,442 |
| 2023 | $2,861 | $269,049 | $82,341 | $186,708 |
| 2022 | $2,840 | $263,775 | $80,727 | $183,048 |
| 2021 | $2,808 | $258,604 | $79,145 | $179,459 |
| 2020 | $2,767 | $255,953 | $78,334 | $177,619 |
| 2019 | $2,733 | $250,936 | $76,799 | $174,137 |
| 2018 | $2,651 | $246,017 | $75,294 | $170,723 |
| 2017 | $2,832 | $241,194 | $73,818 | $167,376 |
| 2016 | $2,841 | $240,966 | $72,371 | $168,595 |
| 2015 | $2,767 | $237,416 | $71,285 | $166,131 |
| 2014 | $2,722 | $232,748 | $69,890 | $162,858 |
Map
- 2968 Coloma St
- 2905 Wood St
- 2940 Conrad St
- 910 Reservoir St
- 901 Union St
- 8325 County Rd M44
- 627 Weaver Way
- 2796 Coloma St
- 837 Vivian Ct
- 2823 Manor Dr
- 0 Lincoln Aly
- 810 Phillip Ct
- 3157 Benham Ct
- 2911 Clay St
- 990 Thompson Way
- 894 Hillcrest St
- 3095 Cedar Ravine Rd
- 837 Hillcrest St
- 949 Bliss Ct
- 3338 Pardi Way
Ask me questions while you tour the home.