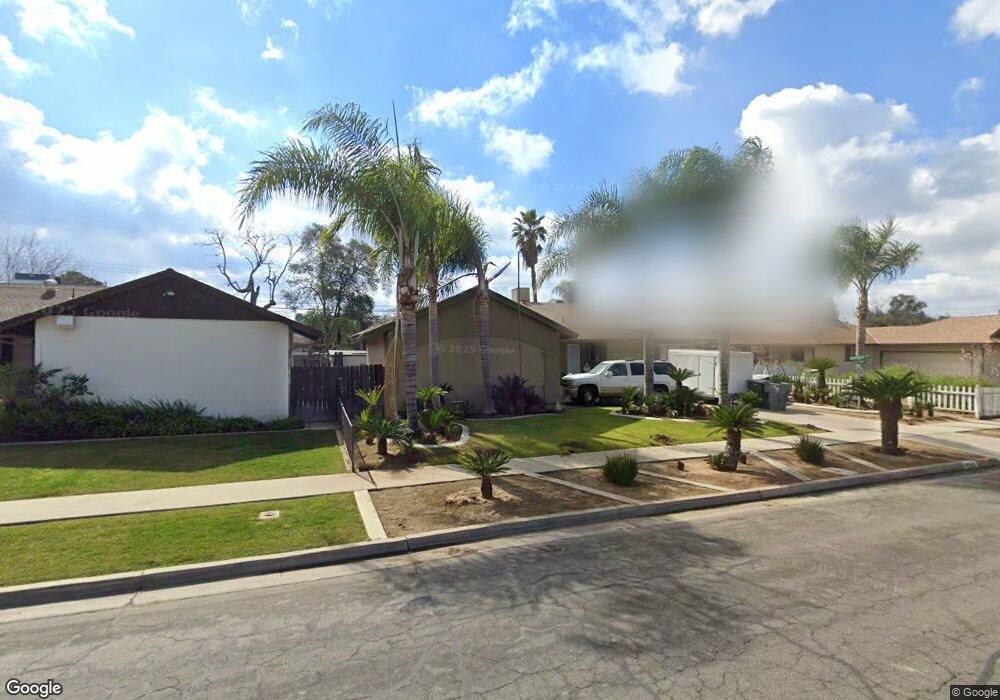
2986 E Willis Ave Fresno, CA 93726
Hoover NeighborhoodEstimated Value: $307,265 - $318,000
3
Beds
2
Baths
1,310
Sq Ft
$240/Sq Ft
Est. Value
About This Home
This home is located at 2986 E Willis Ave, Fresno, CA 93726 and is currently estimated at $314,088, approximately $239 per square foot. 2986 E Willis Ave is a home located in Fresno County with nearby schools including Pyle Elementary School, Tioga Middle School, and Herbert Hoover High School.
Ownership History
Date
Name
Owned For
Owner Type
Purchase Details
Closed on
Feb 18, 2005
Sold by
Marquez Patricia
Bought by
Marquez David
Current Estimated Value
Home Financials for this Owner
Home Financials are based on the most recent Mortgage that was taken out on this home.
Original Mortgage
$132,000
Outstanding Balance
$74,428
Interest Rate
7.45%
Mortgage Type
New Conventional
Estimated Equity
$239,660
Purchase Details
Closed on
Apr 23, 2002
Sold by
Chavez Steven and Chavez Bobbi
Bought by
Marquez David and Marquez Patricia
Purchase Details
Closed on
Jan 26, 1998
Sold by
Magna Funding Corporation
Bought by
Chavez Steven and Chavez Bobbi
Home Financials for this Owner
Home Financials are based on the most recent Mortgage that was taken out on this home.
Original Mortgage
$77,023
Interest Rate
7.07%
Mortgage Type
FHA
Purchase Details
Closed on
Apr 3, 1996
Sold by
Rivas Maria
Bought by
Magna Funding Corp
Create a Home Valuation Report for This Property
The Home Valuation Report is an in-depth analysis detailing your home's value as well as a comparison with similar homes in the area
Home Values in the Area
Average Home Value in this Area
Purchase History
| Date | Buyer | Sale Price | Title Company |
|---|---|---|---|
| Marquez David | -- | Fidelity National Title Co | |
| Marquez David | -- | -- | |
| Chavez Steven | $75,000 | First American Title Ins Co | |
| Magna Funding Corp | $100,350 | Fidelity National Title Ins |
Source: Public Records
Mortgage History
| Date | Status | Borrower | Loan Amount |
|---|---|---|---|
| Open | Marquez David | $132,000 | |
| Previous Owner | Chavez Steven | $77,023 |
Source: Public Records
Tax History
| Year | Tax Paid | Tax Assessment Tax Assessment Total Assessment is a certain percentage of the fair market value that is determined by local assessors to be the total taxable value of land and additions on the property. | Land | Improvement |
|---|---|---|---|---|
| 2025 | $1,406 | $113,726 | $28,056 | $85,670 |
| 2023 | $1,324 | $109,312 | $26,967 | $82,345 |
| 2022 | $1,305 | $107,170 | $26,439 | $80,731 |
| 2021 | $1,268 | $105,070 | $25,921 | $79,149 |
| 2020 | $1,262 | $103,994 | $25,656 | $78,338 |
| 2019 | $1,212 | $101,955 | $25,153 | $76,802 |
| 2018 | $1,185 | $99,957 | $24,660 | $75,297 |
| 2017 | $1,163 | $97,998 | $24,177 | $73,821 |
| 2016 | $1,123 | $96,077 | $23,703 | $72,374 |
| 2015 | $1,105 | $94,634 | $23,347 | $71,287 |
| 2014 | $1,084 | $92,781 | $22,890 | $69,891 |
Source: Public Records
Map
Nearby Homes
- 2733 E Willis Ave
- 2826 E Hampton Way
- 4090 N Sherman St
- 4005 N 1st St
- 3144 E Sussex Way
- 2625 E Sussex Way
- 3365 E Ashlan Ave
- 2952 E Gettysburg Ave
- 2333 E Austin Way
- 3979 N Drexel Ave
- 2407 Ashcroft Ct
- 4136 N Thesta #36 St
- 4136 N Thesta St Unit 36
- 2326 E Hampton Way
- 4281 N 5th St
- 4365 N 5th St
- 4376 N 5th St
- 2224 E Donner Ave
- 4723 N Angus St
- 4741 N Orchard St
- 2998 E Willis Ave
- 2974 E Willis Ave
- 2987 E Austin Way
- 2999 E Austin Way
- 2975 E Austin Way
- 3002 E Willis Ave
- 2962 E Willis Ave
- 2985 E Willis Ave
- 3003 E Austin Way
- 2963 E Austin Way
- 2973 E Willis Ave
- 2997 E Willis Ave
- 3014 E Willis Ave
- 2950 E Willis Ave
- 2961 E Willis Ave
- 3001 E Willis Ave
- 3015 E Austin Way
- 2951 E Austin Way
- 2978 E Austin Way
- 2988 E Swift Ave
Your Personal Tour Guide
Ask me questions while you tour the home.